

Choose your next tires
Tire Performance Insights
Explore how tires compare across published tests and different driving priorities.
Use this tool
Use the filters below to explore tire performance data from our test database. Select a starting year to see all tests from that year onwards.
Beta
This tool is currently in beta. Rankings are derived from aggregated test data and may be influenced by variations in testing methodologies across publications. Multi-category tests can affect individual category scores.
How Rankings Work (All-Round)
Rankings are calculated using a weighted combination of performance categories.
Current Weighting:
Wet 12% Dry 12% Snow 6% Comfort 8% Value 7% Test Position 55%
Scoring Factors:
- Category Scores: Average percentile performance in Wet, Dry, Comfort, and Value categories across all tests.
- Test Position: Overall ranking position in professional tire tests.
- Confidence: More tests = higher confidence. Green badge (5+ tests), Yellow (3-4 tests), Red (1-2 tests).
65
Tests
342
tires
2026
Year Range
Tire Performance Insights
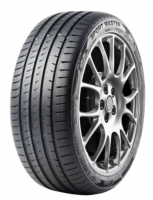
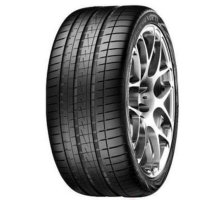
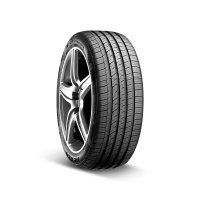
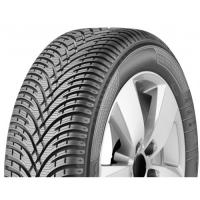
| Rank | Tire | Tests | Overall | Wet | Dry | Snow | Comfort | Best | ||
|---|---|---|---|---|---|---|---|---|---|---|
| 1 |
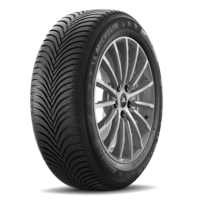
|
5 tests | 1 | |||||||
| 2 |
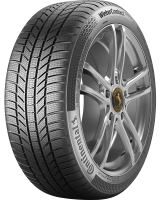
|
6 tests | 1 | |||||||
| 3 |
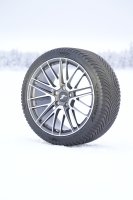
|
7 tests | 1 | |||||||
| 4 |
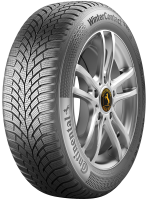
|
4 tests | 1 | |||||||
| 5 |
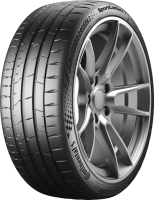
|
5 tests | - | 1 | ||||||
| 6 |

|
2 tests | 1 | |||||||
| 7 |
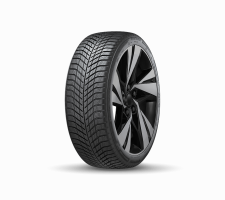
|
3 tests | 1 | |||||||
| 8 |
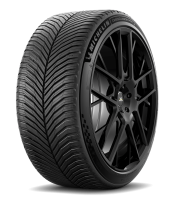
|
5 tests | 1 | |||||||
| 9 |
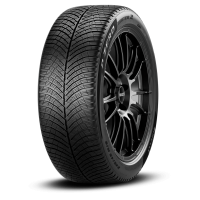
|
3 tests | 1 | |||||||
| 10 |
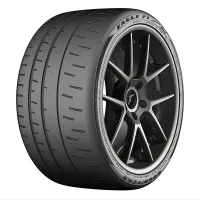
|
2 tests | - | - | - | 1 | ||||
| 11 |

|
6 tests | 1 | |||||||
| 12 |
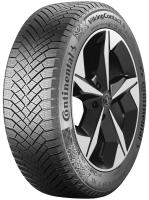
|
3 tests | 1 | |||||||
| 13 |
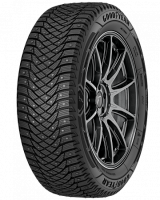
|
2 tests | 2 | |||||||
| 14 |
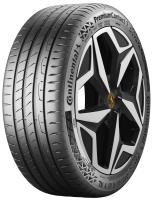
|
10 tests | - | 1 | ||||||
| 15 |
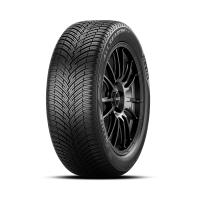
|
12 tests | 1 | |||||||
| 16 |
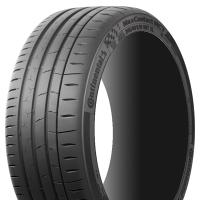
|
3 tests | - | 1 | ||||||
| 17 |
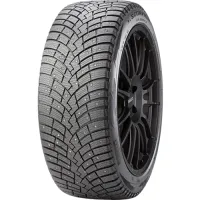
|
2 tests | 1 | |||||||
| 18 |
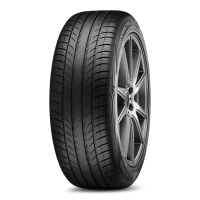
|
3 tests | 2 | |||||||
| 19 |

|
5 tests | - | 2 | ||||||
| 20 |
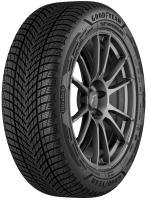
|
12 tests | 1 | |||||||
| 21 |
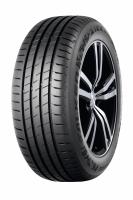
|
3 tests | - | 1 | ||||||
| 22 |
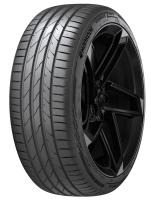
|
7 tests | - | 1 | ||||||
| 23 |

|
2 tests | 2 | |||||||
| 24 |
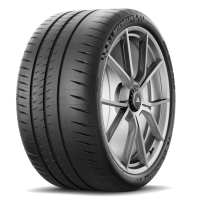
|
2 tests | - | 1 | ||||||
| 25 |
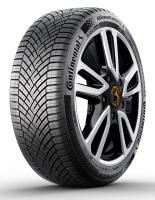
|
13 tests | 1 | |||||||
| 26 |
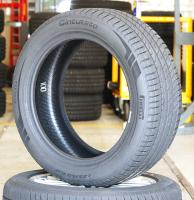
|
8 tests | - | 1 | ||||||
| 27 |
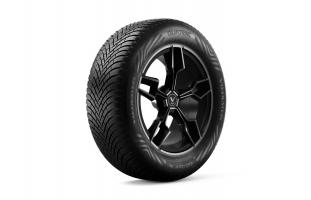
|
4 tests | 1 | |||||||
| 28 |
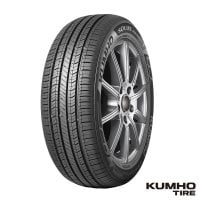
|
2 tests | - | 1 | ||||||
| 29 |
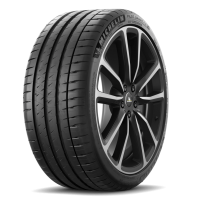
|
4 tests | - | 1 | ||||||
| 30 |
|
2 tests | - | 3 | ||||||
| 31 |

|
2 tests | - | - | - | 1 | ||||
| 32 |

|
2 tests | - | - | - | 2 | ||||
| 33 |
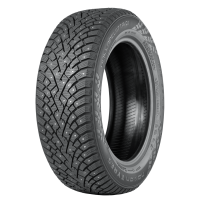
|
2 tests | 1 | |||||||
| 34 |

|
2 tests | - | - | 1 | |||||
| 35 |
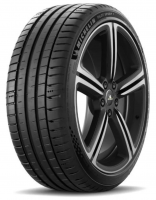
|
8 tests | - | 1 | ||||||
| 36 |
|
7 tests | 2 | |||||||
| 37 |
|
4 tests | 2 | |||||||
| 38 |
|
11 tests | 2 | |||||||
| 39 |
|
4 tests | 3 | |||||||
| 40 |
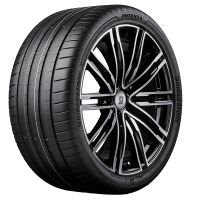
|
2 tests | - | 1 | ||||||
| 41 |
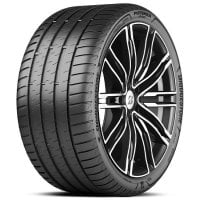
|
7 tests | - | 1 | ||||||
| 42 |
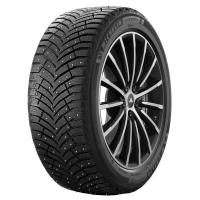
|
2 tests | 3 | |||||||
| 43 |
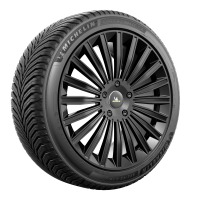
|
8 tests | 1 | |||||||
| 44 |
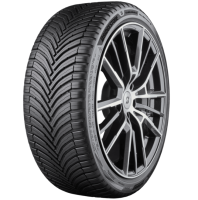
|
11 tests | 1 | |||||||
| 45 |
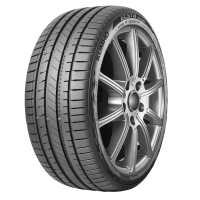
|
8 tests | - | 2 | ||||||
| 46 |
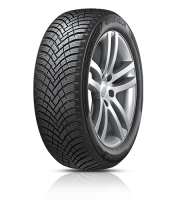
|
6 tests | 3 | |||||||
| 47 |

|
2 tests | 4 | |||||||
| 48 |
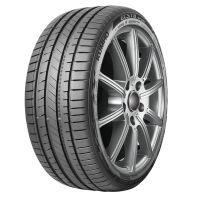
|
2 tests | - | 2 | ||||||
| 49 |
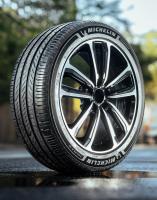
|
9 tests | 1 | |||||||
| 50 |

|
4 tests | - | 3 | ||||||
| 51 |

|
3 tests | 6 | |||||||
| 52 |
|
6 tests | - | 3 | ||||||
| 53 |
|
2 tests | - | 6 | ||||||
| 54 |
|
4 tests | - | 2 | ||||||
| 55 |
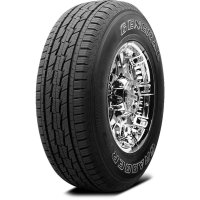
|
2 tests | 1 | |||||||
| 56 |
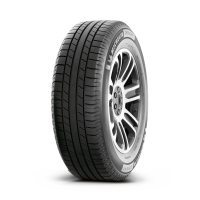
|
2 tests | 2 | |||||||
| 57 |
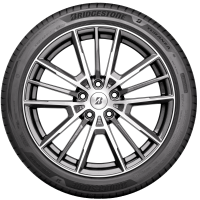
|
4 tests | - | 4 | ||||||
| 58 |
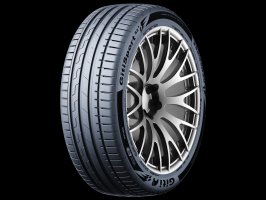
|
4 tests | - | 2 | ||||||
| 59 |

|
2 tests | 3 | |||||||
| 60 |
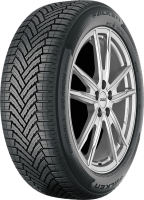
|
3 tests | 6 | |||||||
| 61 |
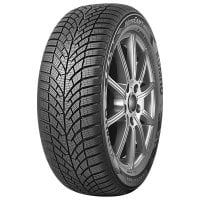
|
4 tests | 6 | |||||||
| 62 |
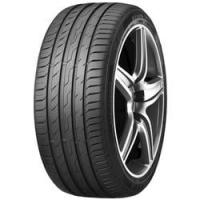
|
4 tests | - | 3 | ||||||
| 63 |
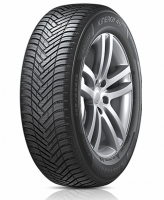
|
5 tests | 5 | |||||||
| 64 |
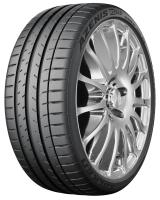
|
2 tests | - | 7 | ||||||
| 65 |
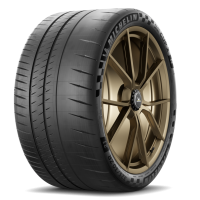
|
2 tests | - | - | 1 | |||||
| 66 |
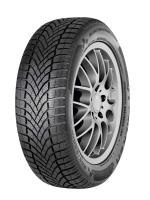
|
2 tests | 7 | |||||||
| 67 |

|
9 tests | 4 | |||||||
| 68 |
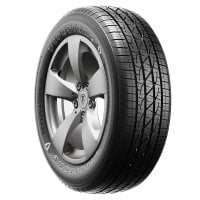
|
2 tests | 2 | |||||||
| 69 |
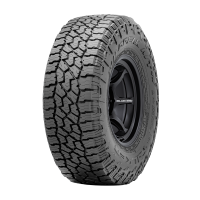
|
2 tests | 3 | |||||||
| 70 |
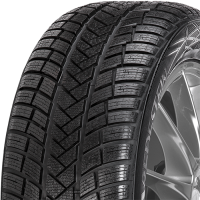
|
5 tests | 5 | |||||||
| 71 |
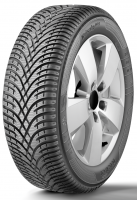
|
3 tests | 5 | |||||||
| 72 |
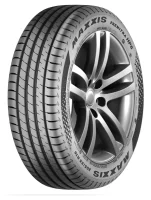
|
7 tests | - | 4 | ||||||
| 73 |
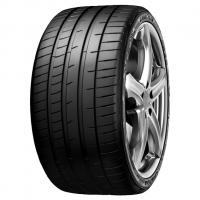
|
4 tests | - | 2 | ||||||
| 74 |
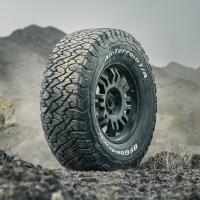
|
2 tests | 3 | |||||||
| 75 |
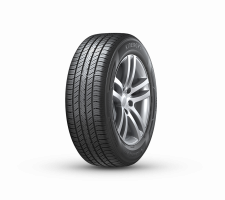
|
2 tests | - | 4 | ||||||
| 76 |
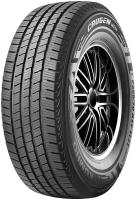
|
2 tests | 4 | |||||||
| 77 |
|
2 tests | 8 | |||||||
| 78 |
|
2 tests | 3 | |||||||
| 79 |
|
4 tests | - | 6 | ||||||
| 80 |
|
5 tests | - | 3 | ||||||
| 81 |

|
3 tests | 7 | |||||||
| 82 |
|
5 tests | - | 1 | ||||||
| 83 |

|
2 tests | - | 8 | ||||||
| 84 |
|
4 tests | - | 2 | ||||||
| 85 |
|
2 tests | - | 2 | ||||||
| 86 |
|
2 tests | 10 | |||||||
| 87 |
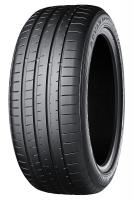
|
4 tests | - | 4 | ||||||
| 88 |
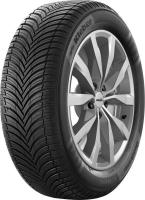
|
3 tests | 7 | |||||||
| 89 |
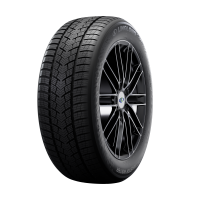
|
6 tests | 3 | |||||||
| 90 |
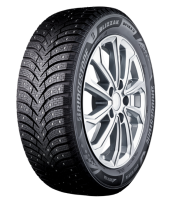
|
2 tests | 6 | |||||||
| 91 |

|
3 tests | 9 | |||||||
| 92 |
|
2 tests | - | 8 | ||||||
| 93 |
|
4 tests | - | 5 | ||||||
| 94 |
|
4 tests | 10 | |||||||
| 95 |

|
3 tests | 7 | |||||||
| 96 |

|
2 tests | 9 | |||||||
| 97 |

|
3 tests | 6 | |||||||
| 98 |
|
2 tests | 11 | |||||||
| 99 |
|
2 tests | 5 | |||||||
| 100 |

|
2 tests | 9 |
Understanding the Data
- Overall score is calculated from normalized test results, adjusted for test count and consistency.
- Confidence levels: High (5+ tests), Medium (3-4 tests), Low (1-2 tests).
- Category scores show average performance in that specific area across all tests.
90%+ Excellent
80-89% Very Good
70-79% Good
60-69% Fair
<60% Poor

Next step