Compare Tires
813 comparisons from 374 independent tests that drove both tires back to back, showing where each one finished and the numbers side by side, plus the 6,441 owner reviews written about those tires.
- 813head-to-head comparisons
- 221tires covered
- 374independent tests behind them
- 6,441owner reviews of those tires
Build a comparison
Pick two tires, or add up to eight. Only tires that have shared a test can be ranked against each other, so the search narrows as you choose.

Most compared this month
Ordered by how often each comparison was opened in the last 30 days.
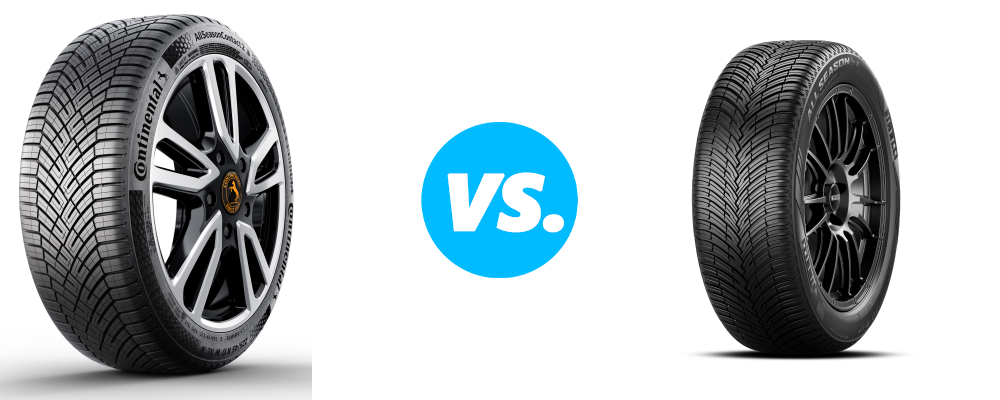 All Season Continental AllSeasonContact 2 vs Pirelli Cinturato All Season SF3
Pirelli 16-10 27 shared tests
9.5 Continental
9.6 Pirelli
 All Season Continental AllSeasonContact 2 vs Michelin CrossClimate 2
Continental 8-5 14 shared tests
9.5 Continental
9.5 Michelin
 Summer Goodyear Eagle F1 Asymmetric 6 vs Michelin Pilot Sport 5
Goodyear 8-5 16 shared tests
9.6 Goodyear
9.4 Michelin
 Winter Continental WinterContact TS 870 P vs Goodyear UltraGrip Performance 3
Goodyear 17-8 26 shared tests
9.3 Continental
9.5 Goodyear
 All Season Continental AllSeasonContact 2 vs Goodyear Vector 4Seasons Gen 3
Continental 16-1 18 shared tests
9.5 Continental
9.5 Goodyear
 Summer Continental PremiumContact 7 vs Michelin Primacy 5
Continental 10-2 13 shared tests
9.5 Continental
8.8 Michelin
All Season tire comparisons
The all season head-to-heads with the most readers, and how each pair has finished when a test drove both.
Winter tire comparisons
The winter head-to-heads with the most readers, and how each pair has finished when a test drove both.
Summer tire comparisons
The summer head-to-heads with the most readers, and how each pair has finished when a test drove both.
All Weather tire comparisons
The all weather head-to-heads with the most readers, and how each pair has finished when a test drove both.
| # | Comparison | Shared tests | Head-to-head | TR Score |
|---|---|---|---|---|
| 1 | Goodyear Assurance WeatherReady 2 vs Michelin CrossClimate 2 AW | 3 | Michelin 2-1 | 8.7 / 9.4 |
| 2 | Michelin CrossClimate 2 AW vs Nokian Remedy WRG5 | 2 | Michelin 2-0 | 9.4 / 7 |
| 3 | Bridgestone WeatherPeak vs Michelin CrossClimate 2 AW | 5 | Michelin 4-1 | 6 / 9.4 |
| 4 | Michelin CrossClimate 2 AW vs Pirelli Cinturato WeatherActive | 3 | Pirelli 2-1 | 9.4 / 8.1 |
| 5 | Bridgestone WeatherPeak vs Goodyear Assurance WeatherReady 2 | 3 | Goodyear 3-0 | 6 / 8.7 |
| 6 | Goodyear Assurance WeatherReady vs Michelin CrossClimate 2 AW | 2 | Michelin 2-0 | 7 / 9.4 |
| 7 | Goodyear Assurance WeatherReady 2 vs Michelin Defender 2 | 2 | Goodyear 2-0 | 8.7 / 7.1 |
| 8 | Bridgestone WeatherPeak vs Nokian Remedy WRG5 | 2 | Level, 1-1 | 6 / 7 |
| 9 | Bridgestone WeatherPeak vs Pirelli Cinturato WeatherActive | 3 | Pirelli 3-0 | 6 / 8.1 |
| 10 | Bridgestone WeatherPeak vs Michelin Defender 2 | 2 | Level, 1-1 | 6 / 7.1 |
| 11 | Bridgestone WeatherPeak vs Michelin Primacy Tour AS | 2 | Level, 1-1 | 6 / 8.6 |

The most compared tires
The models that appear in the most comparisons. Each one has its own page with the full test record, the owner reviews and the sizes it is made in.
 Michelin CrossClimate 2
9.5
Most read against Continental AllSeasonContact 2
 Goodyear Eagle F1 Asymmetric 6
9.6
Most read against Michelin Pilot Sport 5
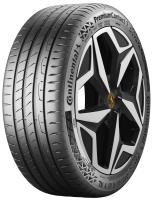 Continental PremiumContact 7
9.5
Most read against Michelin Primacy 5
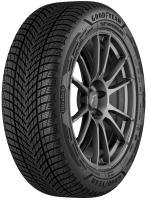 Goodyear UltraGrip Performance 3
9.5
Most read against Continental WinterContact TS 870 P
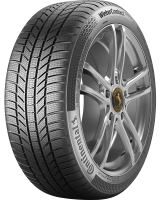 Continental WinterContact TS 870 P
9.3
Most read against Goodyear UltraGrip Performance 3
 Bridgestone Blizzak 6
9.4
Most read against Goodyear UltraGrip Performance 3
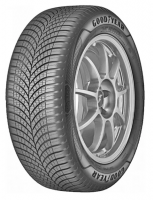 Goodyear Vector 4Seasons Gen 3
9.5
Most read against Continental AllSeasonContact 2
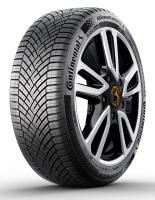 Continental AllSeasonContact 2
9.5
Most read against Pirelli Cinturato All Season SF3
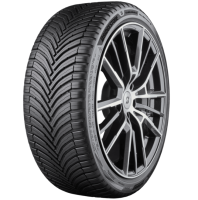 Bridgestone Turanza All Season 6
9.4
Most read against Continental AllSeasonContact 2
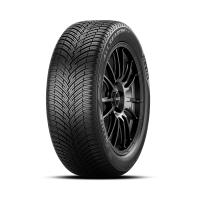 Pirelli Cinturato All Season SF3
9.6
Most read against Continental AllSeasonContact 2
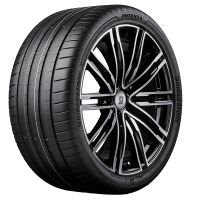 Bridgestone Potenza Sport
9.3
Most read against Michelin Pilot Sport 4 S
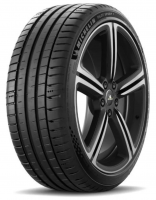 Michelin Pilot Sport 5
9.4
Most read against Goodyear Eagle F1 Asymmetric 6
Brand against brand
Brand-against-brand records across every test we hold for both.
 vs
 Michelin vs Yokohama
 vs
 Hankook vs Pirelli
vs
Hankook vs Michelin
 vs
Goodyear vs Pirelli
vs
Goodyear vs Michelin
vs
Goodyear vs Hankook
 vs
Continental vs Pirelli
vs
Continental vs Hankook
vs
Continental vs Goodyear
 vs
Bridgestone vs Pirelli
vs
Bridgestone vs Hankook
vs
Bridgestone vs Goodyear
vs
Bridgestone vs Continental
vs
Michelin vs Pirelli
vs
Continental vs Michelin
vs
Bridgestone vs Michelin
Group comparisons
Three or more tires ranked together on the tests they all appeared in, with the category weightings adjustable.
- Goodyear Eagle F1 Asymmetric 6 vs Michelin Pilot Sport 5 vs Continental PremiumContact 7
- Goodyear Vector 4Seasons Gen 3 vs Michelin CrossClimate 2 vs Continental AllSeasonContact 2
- Michelin CrossClimate 2 vs Bridgestone Turanza All Season 6 vs Continental AllSeasonContact 2 vs Pirelli Cinturato All Season SF3
- Michelin Pilot Sport 4 S vs Pirelli P Zero PZ4 vs Continental SportContact 7
- Michelin Pilot Sport All Season 4 vs Continental ExtremeContact DWS 06 PLUS vs Pirelli P Zero AS Plus 3
- Linglong Sport Master vs Yokohama Advan Sport V107 vs Goodyear Eagle F1 Asymmetric 6 vs Michelin Pilot Sport 5 vs Continental PremiumContact 7
- Hankook Ventus S1 evo 3 vs Continental SportContact 7 vs Michelin Pilot Sport 5
- Continental SportContact 7 vs Goodyear Eagle F1 Asymmetric 6 vs Michelin Pilot Sport 5
- Bridgestone Potenza Sport vs Continental SportContact 7 vs Michelin Pilot Sport 5 vs Kumho Ecsta Sport PS72
Recently added
The newest head-to-heads on the site.
- Dunlop Winter vs Hankook Winter I cept RS3
- Continental SportContact 7 vs Hankook Ventus S1 evo 3
- Goodyear Eagle F1 Asymmetric 6 vs Michelin Pilot Sport 4
- Dunlop All Season 2 vs Goodyear Vector All Season 4
- Bridgestone Blizzak 6 vs Dunlop Winter Sport 5
- Barum Polaris 6 vs Continental WinterContact TS 870 P
Browse comparisons by brand
Every comparison a brand appears in, on one page per brand. 44 brands are represented.
Premium brands

Mid-Range brands


Economy brands


How a comparison is built
A tire test is only fair within itself. The same car, the same track, the same weather and the same driver on the same day is what makes one tire's wet braking distance comparable to another's. So a comparison starts by finding every published independent test that included both tires, and everything else follows from those tests alone.
From each shared test we take the finishing position and the measured numbers behind it: wet and dry braking distances, handling lap times, aquaplaning speeds, rolling resistance, noise, and wear where the test measured it. The head-to-head record on this page counts how often each tire finished ahead. The comparison page itself goes further and shows the margin in every discipline, because a tire that loses narrowly on dry handling and wins heavily in the wet is the better tire for most drivers.
Owner reviews sit alongside the test data, never inside it. They come from drivers who submitted them to this site, each naming the car, the size and the distance covered, and each read by a person before it was published. Test data tells you how a tire performs when new on a closed track; owners tell you what it is like after 20,000 miles.
The TR Score shown against each tire rates it out of 10 on every test and owner review we hold for it, not just the shared ones, weighted by how much evidence backs it. Two tires can therefore have close scores and a lopsided head-to-head record, or the reverse.
Common questions
How do you compare two tires?
Every comparison starts from the independent tests where both tires were driven back to back, on the same day, in the same size. We record where each tire finished in every one of those tests and the numbers behind each discipline - wet braking distances, dry handling lap times, rolling resistance, noise - then set the two side by side. Owner reviews from drivers who have run the tires are shown alongside the test data, never mixed into it. Across this section that means 813 comparisons drawn from 374 independent tests and the 6,441 owner reviews written about the tires in them.
What is a shared test?
A shared test is one independent tire test that included both tires. It is the only way to compare two tires fairly: the same track, the same car, the same weather and the same tester on the same day. Two tires that each won a different test in a different year have not actually been compared at all, so a comparison with no shared tests carries no head-to-head record.
Which tire comparison is the most read?
Continental AllSeasonContact 2 vs Pirelli Cinturato All Season SF3 is the comparison drivers run most often on this site. Pirelli Cinturato All Season SF3 finished ahead in 16 of the 27 tests they have shared.
Can I compare more than two tires?
Yes. Pick up to eight tires and the comparison is built on the tests all of them share, with the category weightings adjustable so the ranking reflects what you actually drive in. A group comparison needs at least two tests that included every tire chosen, otherwise there is nothing to compare them on.
Are these comparisons independent?
The test results come from published independent tests - our own and those of magazines and motoring organizations across Europe and North America - and the owner reviews come from drivers who submitted them to this site and were checked by hand before publication. No manufacturer pays for a placing, a score or a verdict.
Run one of these tires?
Review it and the next driver comparing it against something else gets your experience alongside the test data. It takes about five minutes.
Where this data comes from
Test results are read out of published independent tests - our own and those of magazines and motoring organizations across Europe and North America. Owner reviews are submitted through this site and checked by hand before publication.
What the TR Score is
One number out of 10 for a tire's standing across every test and owner review we hold for it, weighted by how much evidence backs it. It is not the head-to-head record, which counts only the tests the two tires shared - so two tires can have close scores and a lopsided record, or the reverse.
How often it updates
Comparisons rebuild as new tests are published and new reviews arrive, so a tire's record here changes through its life rather than being fixed at launch.