

Bridgestone vs Goodyear
358 shared professional tests: Goodyear finished ahead in 215, Bridgestone in 137 and 6 were drawn. Owners rate Goodyear 7.9 and Bridgestone 7.1 out of 10 across 6,669 reviews.
The quick answer
 Bridgestone
Premium · 210 tires on sale · Bridgestone Group
 Goodyear
Premium · 145 tires on sale · Goodyear Group
Goodyear leads in more of the categories we measure. Built from every professional test both brands entered and every vetted owner review we hold for their tires - the evidence is all further down the page. Data updated October 29, 2026.

Bridgestone vs Goodyear at a glance
Bridgestone and Goodyear are both premium brands with huge OEM presence and deep motorsport and R&D heritage - Bridgestone founded in 1931 (Tokyo), Goodyear in 1898 (Akron).
The numbers here show a clear split: Goodyear more often finishes ahead when the two brands meet in the same test, but Bridgestone regularly tops the most fundamental objective performance measures, particularly braking and rolling resistance.
| Category | Bridgestone | Goodyear | Winner |
|---|---|---|---|
| Overall test record | 137 wins | 215 wins | Goodyear |
| Wet Braking | 130 ft | 132 ft | Bridgestone |
| Dry Braking | 126 ft | 128 ft | Bridgestone |
| Snow Braking | 79 ft | 77 ft | Goodyear |
| Rolling Resistance | 7.87 kg/t | 8.01 kg/t | Bridgestone |
| Noise | 71.65 dB | 70.88 dB | Goodyear |
| Tread life (wear tests) | 25,035 miles | 30,553 miles | Goodyear |
| Price | cheaper in 74 of 135 tests | cheaper in 55 of 135 tests | Bridgestone |
| Overall owner score | 7.1 / 10 | 7.9 / 10 | Goodyear |
Head-to-head test record
Across 358 professional tests where both brands fielded a tire, Goodyear finished ahead in 215 and Bridgestone in 137 (6 drew).
By season
| Category | shared tests | Bridgestone | Goodyear | draws |
|---|---|---|---|---|
| Summer | 168 | 72 | 93 | 3 |
| Winter | 117 | 38 | 77 | 2 |
| All Season | 68 | 25 | 42 | 1 |
| All Weather | 4 | 1 | 3 | 0 |
In true like-for-like comparison - 339 shared tests where both brands appeared and each is represented by its best-placed tire - Goodyear wins 204 to Bridgestone's 130 (with 5 draws). That aligns with the average finishing strength: Goodyear's average finish percentile is 76 versus Bridgestone's 62.1, meaning Goodyear more consistently lands higher up the order overall, even though Bridgestone can still lead key standalone disciplines within those tests.
How we count: only tests entered by both brands are used, and each brand is represented by its best-placed tire in that test. Owner-review and label figures cover the brands' full current ranges.
Performance by metric
Averaged across shared tests, which brand leads each measured discipline and by how much.
Bridgestone won 124 of 211 tests · 4.9% typical margin
Bridgestone won 114 of 203 tests · 3.5% typical margin
Goodyear won 89 of 171 tests · 3.1% typical margin
Bridgestone won 93 of 155 tests · 8.1% typical margin
Goodyear won 100 of 142 tests · 1.7% typical margin
Goodyear won 70 of 114 tests · 3.6% typical margin
Bridgestone won 60 of 103 tests · 1.1% typical margin
Goodyear won 54 of 103 tests · 1.9% typical margin
Goodyear won 55 of 103 tests · 8.2% typical margin
Goodyear won 36 of 62 tests · 1.9% typical margin
Goodyear won 43 of 60 tests · 3.8% typical margin
Goodyear won 44 of 57 tests · 2.3% typical margin
Bridgestone won 47 of 87 tests · 2.5% typical margin
Bridgestone won 46 of 87 tests · 5.1% typical margin
Goodyear won 38 of 71 tests · 2.4% typical margin
Bridgestone won 37 of 65 tests · 9.6% typical margin
Goodyear won 46 of 59 tests · 2.2% typical margin
Bridgestone won 24 of 45 tests · 1.1% typical margin
Bridgestone won 30 of 45 tests · 2.6% typical margin
Goodyear won 19 of 38 tests · 6.2% typical margin
Bridgestone won 15 of 25 tests · 1.4% typical margin
Goodyear won 14 of 24 tests · 0.8% typical margin
Goodyear won 10 of 23 tests
Goodyear won 13 of 21 tests
Bridgestone won 48 of 55 tests · 6% typical margin
Bridgestone won 36 of 55 tests · 4.6% typical margin
Goodyear won 34 of 45 tests · 5.3% typical margin
Bridgestone won 23 of 43 tests · 3.5% typical margin
Bridgestone won 22 of 40 tests · 7% typical margin
Goodyear won 27 of 36 tests · 1.1% typical margin
Goodyear won 22 of 31 tests · 9.8% typical margin
each won 13 of 27 tests
Goodyear won 21 of 27 tests · 1.5% typical margin
Goodyear won 23 of 27 tests · 5.6% typical margin
Goodyear won 20 of 26 tests · 3.1% typical margin
Goodyear won 12 of 19 tests
Bridgestone won 42 of 65 tests · 4.9% typical margin
Goodyear won 36 of 65 tests · 2.3% typical margin
Goodyear won 36 of 57 tests · 2.4% typical margin
Goodyear won 31 of 55 tests · 3.7% typical margin
Bridgestone won 32 of 48 tests · 6.6% typical margin
Goodyear won 27 of 45 tests · 1.5% typical margin
Goodyear won 20 of 33 tests · 2.2% typical margin
Bridgestone won 17 of 32 tests · 7.6% typical margin
Bridgestone won 23 of 31 tests · 1.1% typical margin
Goodyear won 19 of 31 tests · 1.3% typical margin
Goodyear won 24 of 31 tests · 1.7% typical margin
Goodyear won 13 of 18 tests · 1.7% typical margin
Across the big objective safety and efficiency metrics, Bridgestone has the edge on braking and energy loss: wet braking averages 39.51 m vs 40.05 m for Goodyear (115 metric wins to 74), dry braking averages 38.24 m vs 38.8 m (109 wins to 74), and rolling resistance averages 7.9 kg/t vs 8.01 kg/t (85 wins to 55). Goodyear's strengths tilt towards refinement and adverse conditions: it leads noise (70.83 dB vs 71.58 dB, with 92 wins to 31), aquaplaning metrics like straight aquaplaning speed (80.77 km/h vs 80.43 km/h, 86 wins to 69) and curved aquaplaning (51 wins to 37), and winter capability indicators such as snow braking (23.31 m vs 23.79 m, 61 wins to 36) plus snow traction and snow handling where it wins decisively in the available datasets.
Typical margin is the average gap between the two brands within a single test. Test conditions vary, so it can be larger than the difference between the overall averages shown. Judged scores use a different scale in each test, so only the win record is comparable.
Which brand wins each season
Head-to-head test wins by season.
Goodyear leads 93 to 72 here
- Bridgestone strongest at
- Subj. Noise
- Goodyear strongest at
- Wear
Goodyear leads 42 to 25 here
- Bridgestone strongest at
- Subj. Snow Handling
- Goodyear strongest at
- Wear
Goodyear leads 77 to 38 here
- Bridgestone strongest at
- Ice Traction
- Goodyear strongest at
- Subj. Noise
By season, Goodyear leads the shared-test head-to-head in all the main categories: in Summer it wins 92 of 166 shared tests versus Bridgestone's 71 (3 draws), in Winter it's 72 of 109 versus 36 (1 draw), and in All Season it's 38 of 60 versus 21 (1 draw). Within-season metric breakdowns explain why: in Summer Bridgestone leads dry braking (47-36), wet braking (45-39), rolling resistance (37-26) and wet handling in km/h (30-14), while Goodyear dominates noise (46-11) and edges aquaplaning (straight aqua 38-30, curved 19-15). In Winter, Bridgestone still leads wet braking (37-20), rolling resistance (27-13) and dry handling (19-8), but Goodyear leads dry braking (30-19), straight aquaplaning (28-19), noise (23-13) and the snow fundamentals (snow braking 31-23 and snow traction 18-9). All Season is the same story turned up: Bridgestone strongly leads dry braking (43-5) and wet braking (33-12), but Goodyear leads snow braking (30-10), noise (23-6) and curved aquaplaning (20-7), which tends to translate into higher overall test placements.
What owners say
Owner reviews, vetted by hand before publication and weighted by how many reviews each tire has. Ownership is not verified.
Owners rate Goodyear higher overall, with a review-weighted 7.94 out of 10 from 3,199 reviews, versus Bridgestone's 7.08 from 3,334 reviews. The biggest real-world separators are the ownership signals: Goodyear scores higher on Wear (7.68 vs 6.74) and Buy Again (7.56 vs 6.2), alongside higher Comfort (7.99 vs 6.75) and Wet Grip (8.22 vs 7.26). Bridgestone's best owner-reported area is also clear - Dry Grip is solid at 8.18 - but Goodyear is higher there too (8.63), making Goodyear the more consistently liked brand in day-to-day driving feedback.
Price & value
How long each brand lasts, and how they compare on price.
Tread life (wear tests)
Goodyear lasted longer in wear testing, winning 45 of 50 tests by an average of 27.9%.
Price
Bridgestone was the cheaper of the two in 74 of 135 shared tests.
On average Bridgestone cost about 1.2% less than Goodyear.
Tread life is a major value lever here, and the wear testing strongly favors Goodyear: across 44 wear tests it averages 49,658.59 km versus Bridgestone's 40,059.05 km, a 29.6% gap, with Goodyear winning 40 of the 44 comparisons. Pricing, however, is close in shared tests: across 124 price samples Bridgestone is on average 0.7% cheaper than Goodyear (Bridgestone cheaper in 64 tests, Goodyear cheaper in 55). Put together, that points to Goodyear often offering the better cost-per-kilometer even when the ticket price is similar, while Bridgestone can still appeal if you find it at a stronger discount or prioritize its braking-led performance profile.
Fuel economy & EU labels
Current range
How broad each brand's current line-up is.
Bridgestone
| Passenger Car | SUV / 4x4 | Motorcycle | Van | |
|---|---|---|---|---|
| Summer | 82 | 12 | 32 | 1 |
| All Season | 24 | 16 | 9 | 2 |
| Winter | 25 | 3 | - | 1 |
| All Weather | 2 | - | - | - |
Goodyear
| Passenger Car | SUV / 4x4 | Motorcycle | Van | |
|---|---|---|---|---|
| Summer | 35 | 7 | - | 2 |
| All Season | 32 | 32 | - | 1 |
| Winter | 20 | 8 | - | 1 |
| All Weather | 2 | - | - | - |
Bridgestone offers the broader catalogue overall, with 201 active tires and 5,543 total sizes, which increases the chances of finding an exact fitment or niche match, especially in Summer where it has 129 active tires (vs Goodyear's 43). Goodyear is smaller at 139 active tires but is more concentrated in All Season with 65 active tires (vs Bridgestone's 42), and it has more EV-specific entries (5 vs 2) and far more all-terrain options (14 vs 5) - making it the more naturally flexible choice if you are shopping crossovers, light off-road use, or want an all-season-led line-up.
Recommended picks per category
The top-rated current tires from each brand, by season.
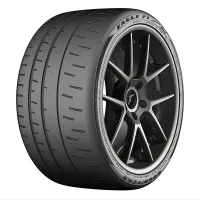
Summer
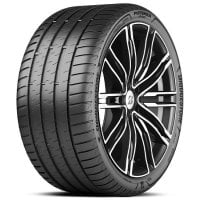

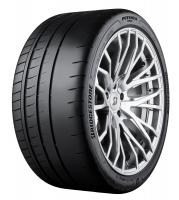
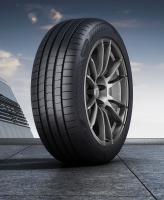
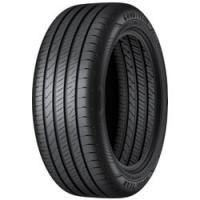
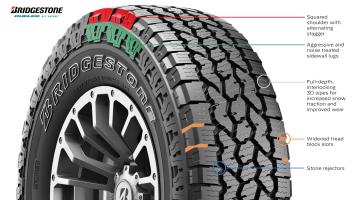
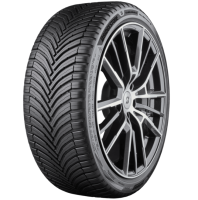
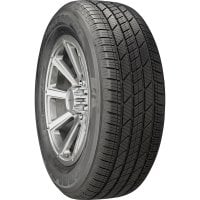
All Season

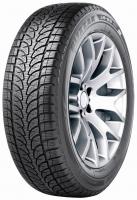
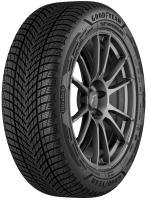
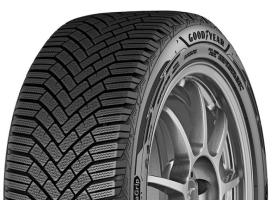
Winter

All Weather
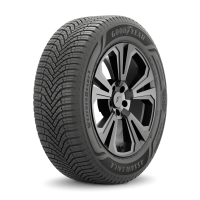 Assurance WeatherReady 2
8.5 score
Popular Bridgestone vs Goodyear tire matchups
Head-to-head comparisons between specific tires from these brands.
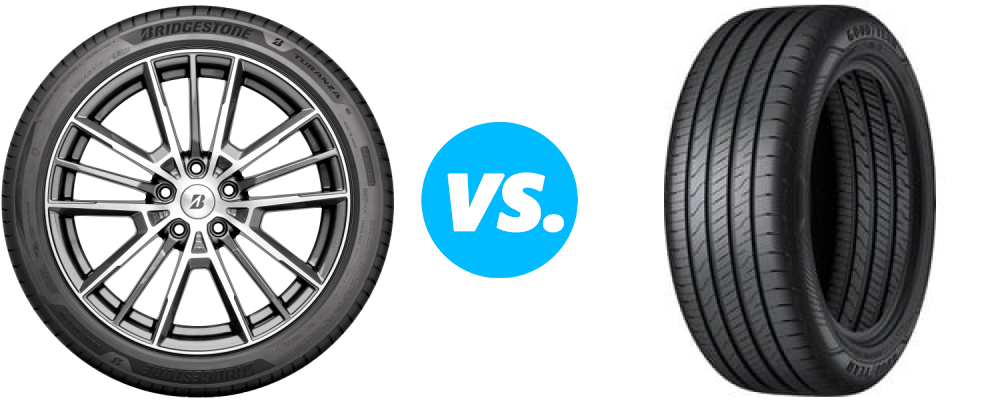 Bridgestone Turanza 6 vs Goodyear EfficientGrip Performance 2
 Bridgestone Blizzak 6 vs Goodyear UltraGrip Performance 3
 Bridgestone Turanza T005 vs Goodyear EfficientGrip Performance 2
 Bridgestone Potenza Sport vs Goodyear Eagle F1 Asymmetric 6
 Bridgestone Turanza All Season 6 vs Goodyear Vector 4Seasons Gen 3
 Bridgestone Potenza Sport vs Goodyear Eagle F1 SuperSport
Frequently asked questions
Is Bridgestone better than Goodyear?
Across 358 shared professional tests, Goodyear finished ahead of Bridgestone in 215 (6 drew), and holds a higher owner-review score of 7.9 vs 7.1 out of 10. Bridgestone leads on value.
Which is better in the wet, Bridgestone or Goodyear?
In Wet Braking, Bridgestone averaged 130 ft versus 132 ft, winning 124 of 211 shared tests. In Wet Handling, Goodyear averaged 47.3 mph versus 47.2 mph, winning 54 of 103 shared tests.
Which lasts longer, Bridgestone or Goodyear?
In independent tire wear testing across 50 shared tests, Goodyear lasted longer, averaging 30,553 miles versus 25,035 miles (about 27.9% further) and winning 45 of them. Owner-rated tread life agrees, at 7.7 vs 6.7 out of 10.
Which is cheaper, Bridgestone or Goodyear?
Bridgestone is usually the cheaper choice, coming in lower in 74 of 135 shared tests, on average about 1.2% less than Goodyear.
Which is better in winter, Bridgestone or Goodyear?
Across 117 shared winter tests, Goodyear finished ahead in 77. 41% of its current range is 3PMSF winter-certified, versus 33% for Bridgestone. In Snow Braking, Goodyear averaged 77 ft versus 79 ft, winning 70 of 114 shared tests.
Which brand is more fuel efficient, Bridgestone or Goodyear?
Fuel economy and EV range come down to rolling resistance. In Rolling Resistance, Bridgestone averaged 7.87 kg/t versus 8.01 kg/t, winning 93 of 155 shared tests. 34% of Bridgestone's current range earns an A or B EU fuel-efficiency grade, versus 43% for Goodyear.
Which is better for electric cars, Bridgestone or Goodyear?
For an EV the priorities are low rolling resistance for range and low noise for a quiet cabin. In rolling-resistance testing, which directly drives EV range, Bridgestone led 93 of 155 shared tests. Goodyear also currently lists 4 EV-specific tires versus 2 for Bridgestone.
Which brand is quieter and more comfortable, Bridgestone or Goodyear?
Owners rate Goodyear higher for comfort, at 8 vs 6.7 out of 10. In Noise, Goodyear averaged 70.88 dB versus 71.65 dB, winning 100 of 142 shared tests.
Would owners buy Bridgestone or Goodyear again?
Goodyear owners are more likely to buy the same brand again, scoring 7.6 vs 6.2 out of 10 on would-buy-again across 6,669 combined reviews.
Final verdict
Category verdicts are split. Bridgestone has the clearer edge on the fundamentals of stopping power and efficiency - it leads wet braking, dry braking and rolling resistance on average, and it shows strong summer and all-season braking leadership in the metric breakdowns. Goodyear, however, more reliably turns its balance of traits into higher overall placings, leading the 339 shared tests 204-130, and it adds clear real-world advantages in wear (49,658.59 km vs 40,059.05 km) and owner satisfaction (7.94 vs 7.08).
Overall lean: Goodyear leads in more areas that typically decide a consumer purchase - total test outcomes, wear, comfort/noise, and winter and all-season head-to-head results - while Bridgestone is the better buy for drivers who prioritize objective braking performance and lower rolling resistance, or who need Bridgestone's broader summer-led range to match a specific fitment.