

The first tire test of 2018 is rather unique. German publication Auto Zeitung have tested six summer and three all season tires all in the same test, and while it's going to make the Tire Reviews version of the results at the bottom of this page read slightly wonky, it's a really interesting way of comparing the dry and wet performances of the two tire types.
Keep in mind, the nine 225/45 R17 tires were only tested in the dry and wet, there was no snow or ice testing to highlight the all season tires year-round abilities. This means this test should just be looked at to see how the all season tires compare to the summer tires in summer conditions, rather than making a purchase decision for year-round motoring.
Dry
Dry braking was a double win for Michelin, with the Pilot Sport 4 the best summer tire and the Michelin CrossClimate+ the best all season tire. While the CrossClimate+ beat the other two all season tires by a considerable margin, it was unable to match even the cheapest Giti tire during dry braking.
Dry Braking
Dry braking in feet
Lower is better ↓| Position / Tire | Result | Gap to best |
|---|---|---|
| 116 ft | Best | |
| 117 ft | +1 ft | |
| 120 ft | +4 ft | |
| 120 ft | +4 ft | |
| 124 ft | +8 ft | |
| 125 ft | +9 ft | |
| 128 ft | +12 ft | |
| 139 ft | +23 ft | |
| 141 ft | +25 ft |
The difference between best and worst was 21.8% (25 ft ≈ 1.7 Car Lengths).
Michelin once again had a double win during dry handling, but this time with the CrossClimate further away from the summer tires. The new Continental AllSeasonContact sat between the Michelin CrossClimate and Goodyear Vector 4Seasons Gen-2 in the dry.
Dry Handling
Dry handling time in seconds
Lower is better ↓| Position / Tire | Result | Gap to best |
|---|---|---|
| 62.8 s | Best | |
| 63.1 s | +0.30 s | |
| 63.2 s | +0.40 s | |
| 63.3 s | +0.50 s | |
| 63.3 s | +0.50 s | |
| 63.4 s | +0.60 s | |
| 64.6 s | +1.80 s | |
| 65.1 s | +2.30 s | |
| 65.7 s | +2.90 s |
The difference between best and worst was 4.6% (2.9 s).
Wet
Wet braking was won by the Goodyear all season tire, and lost by the Goodyear summer tire! The Continental summer tire beat the Continental all season tire, as did the Michelin summer. The Goodyear EfficientGrip Performance usually scores strongly in the wet, perhaps this is a rogue result.
Wet Braking
Wet braking in feet
Lower is better ↓| Position / Tire | Result | Gap to best |
|---|---|---|
| 161 ft | Best | |
| 161 ft | Best | |
| 162 ft | +1 ft | |
| 164 ft | +3 ft | |
| 167 ft | +6 ft | |
| 167 ft | +6 ft | |
| 181 ft | +20 ft | |
| 184 ft | +23 ft | |
| 186 ft | +25 ft |
The difference between best and worst was 15.3% (25 ft ≈ 1.7 Car Lengths).
Wet handling is a harder test for the all season tires than wet braking, and the best all season tire could only finish fourth overall. In both wet braking and handling, the Michelin, Continental and Falken summer tires were close.
Wet Handling
Wet handling time in seconds
Lower is better ↓| Position / Tire | Result | Gap to best |
|---|---|---|
| 87 s | Best | |
| 87.6 s | +0.60 s | |
| 88.2 s | +1.20 s | |
| 89.3 s | +2.30 s | |
| 90.6 s | +3.60 s | |
| 91 s | +4.00 s | |
| 91.7 s | +4.70 s | |
| 92.1 s | +5.10 s | |
| 92.2 s | +5.20 s |
The difference between best and worst was 6% (5.2 s).
The Michelin and Falken summer tires impress again with the best straight aquaplaning results.
Straight Aqua
Float Speed in mph
Higher is better ↑| Position / Tire | Result | Gap to best |
|---|---|---|
| 48.1 mph | Best | |
| 45.5 mph | -2.6 mph | |
| 45.2 mph | -2.9 mph | |
| 45.2 mph | -2.9 mph | |
| 44.9 mph | -3.2 mph | |
| 44.9 mph | -3.2 mph | |
| 43.4 mph | -4.7 mph | |
| 42.6 mph | -5.5 mph | |
| 41.3 mph | -6.8 mph |
The difference between best and worst was 14.1% (6.8 mph).

Other
Three decibels covered all nine tires during noise testing.
Noise
External noise in dB
Lower is better ↓| Position / Tire | Result | Gap to best |
|---|---|---|
| 70 dB | Best | |
| 70 dB | Best | |
| 70 dB | Best | |
| 71 dB | +1.00 dB | |
| 71 dB | +1.00 dB | |
| 71 dB | +1.00 dB | |
| 72 dB | +2.00 dB | |
| 72 dB | +2.00 dB | |
| 73 dB | +3.00 dB |
The difference between best and worst was 4.3% (3 dB).
Goodyear had a clear lead in fuel use which might explain the wet performance, and Giti and Hankook lead on purchase price. The Falken also proves to be excellent value when balancing the test results against the purchase price.
Rolling Resistance
Rolling resistance in kg t
Lower is better ↓| Position / Tire | Result | Gap to best | Extra fuel / year |
|---|---|---|---|
| 7.76 kg/t | Best | $0 | |
| 8.27 kg/t | +0.51 kg/t | $19 | |
| 8.49 kg/t | +0.73 kg/t | $28 | |
| 8.8 kg/t | +1.04 kg/t | $39 | |
| 8.89 kg/t | +1.13 kg/t | $43 | |
| 8.91 kg/t | +1.15 kg/t | $44 | |
| 8.95 kg/t | +1.19 kg/t | $45 | |
| 9.26 kg/t | +1.50 kg/t | $57 | |
| 9.3 kg/t | +1.54 kg/t | $58 |
The difference between best and worst was 19.8% (1.54 kg / t). Over 12,000 miles a year at $3.60/gal, the Michelin Pilot Sport 4 uses about 16 gal ($58) more fuel than the Goodyear EfficientGrip Performance.
Adjust the assumptions
Calculated estimates, not additional measurements. Use the controls to explore the assumptions.
Sadly wear wasn't tested, but this is an area where Michelin usually excel in.
Results
Michelin Pilot Sport 4
225/45 R17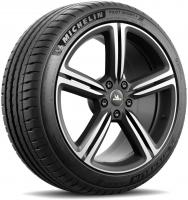
All discipline results (6)
| Test | Result |
|---|---|
| Dry | 131 |
| Wet | 149 |
| Comfort | 6 |
| Rolling Resistance | 11 |
| Noise | 9 |
| Overall | 280 |
Total: 586
- Price
- 450.00
Michelin CrossClimate+
225/45 R17
All discipline results (6)
| Test | Result |
|---|---|
| Dry | 109 |
| Wet | 96 |
| Comfort | 9 |
| Rolling Resistance | 14 |
| Noise | 7 |
| Overall | 205 |
Total: 440
- Price
- 520.00
Goodyear Vector 4 Seasons Gen 2
225/45 R17
All discipline results (6)
| Test | Result |
|---|---|
| Dry | 88 |
| Wet | 117 |
| Comfort | 8 |
| Rolling Resistance | 14 |
| Noise | 10 |
| Overall | 205 |
Total: 442
- Price
- 490.00
Continental Premium Contact 6
225/45 R17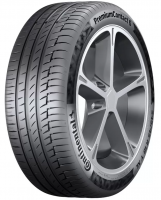
All discipline results (6)
| Test | Result |
|---|---|
| Dry | 126 |
| Wet | 137 |
| Comfort | 5 |
| Rolling Resistance | 15 |
| Noise | 8 |
| Overall | 263 |
Total: 554
- Price
- 450.00
Falken Azenis FK510
225/45 R17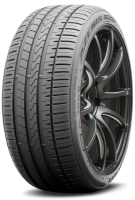
All discipline results (6)
| Test | Result |
|---|---|
| Dry | 123 |
| Wet | 133 |
| Comfort | 5 |
| Rolling Resistance | 12 |
| Noise | 9 |
| Overall | 256 |
Total: 538
- Price
- 330.00
Continental AllSeasonContact
225/45 R17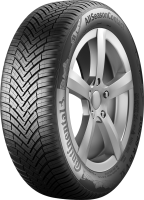
All discipline results (6)
| Test | Result |
|---|---|
| Dry | 94 |
| Wet | 106 |
| Comfort | 7 |
| Rolling Resistance | 18 |
| Noise | 9 |
| Overall | 200 |
Total: 434
- Price
- 510.00
Goodyear EfficientGrip Performance
225/45 R17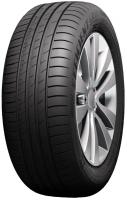
All discipline results (6)
| Test | Result |
|---|---|
| Dry | 128 |
| Wet | 101 |
| Comfort | 7 |
| Rolling Resistance | 25 |
| Noise | 8 |
| Overall | 229 |
Total: 498
- Price
- 390.00
Hankook Ventus Prime 3 K125
225/45 R17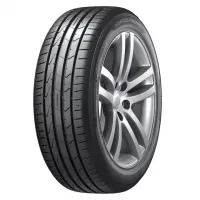
All discipline results (6)
| Test | Result |
|---|---|
| Dry | 129 |
| Wet | 93 |
| Comfort | 6 |
| Rolling Resistance | 11 |
| Noise | 9 |
| Overall | 222 |
Total: 470
- Price
- 310.00
Giti GitiSport S1
225/45 R17
All discipline results (6)
| Test | Result |
|---|---|
| Dry | 119 |
| Wet | 96 |
| Comfort | 7 |
| Rolling Resistance | 14 |
| Noise | 8 |
| Overall | 215 |
Total: 459
- Price
- 290.00
CPC6 "very strong in the dry" with 126 points & Hankook K125 with "average dry performance" with 129 points in the dry sounds a bit bias...
The AZ "dry" scoring also includes comfort, noise and rolling resistance points, which I also separated out but did not subtract from the total dry score. This is why there's a difference between the testers comments and the "dry" scoring.
Hello, the graph of the rolling resistence can’t be correct for the Giti tires, because it’s got the
Same points the Goodyear Efficient Grip Performance has got and in the Test Summary on top
Of the page it’s classified as second.
Well spotted! The graph is correct, the score isn't. Updated :)
I wish manufacturers would produce a summer tire with slightly better snow capability. Enough to get you home, but not as good as the all-season tires, and with no discernible loss of feel and feedback in the summer compared to a premium summer tire. I think this is the tire enthusiastic drivers are waiting for. You could fit it and leave it on all year, without worrying about getting stuck in the snow, and without feeling you're losing out on fun in the summer. Driving home from the dentist in the snow yesterday, in my BMW 130i on Conti Premium Contact 6, I almost didn't make it home. Not a nice feeling. I'd like to fit Michelin Crossclimate+, but I hear feel and feedback are some way off the mark compared to a premium summer tire, so I just can't bring myself to do it. Still waiting for that elusive perfect tire ...
The CrossClimate is as close as we've gotten to that perfect tire. Some of the basic requirements of a tire which works in snow is a higher land/sea ratio (ie, more blocky pattern) and sipes, both of which detract from handling.
Maybe one day the technology will exist, but for now we have to make do with what we have.
Hi. is this Falken Azenis FK510 is a run flat tire ?
This test will have tested the non-runflat version of the tire.
It's a shame all the graphs have a false origin - the scale does not start at zero. This makes the differences appear much larger than they really are. In 'dry handling', for example, there's only a two-second spread in lap times of around a minute. that's 5% and most drivers wouldn't notice such a small change. Please use percentages like Auto Express.
If all the graphs started at 0 they would be almost unreadable, the purpose of the graph would vanish. The graphs look great and start at the right scale.
Yes, the difference somewhere is minimal, and it's up to the reader to notice it and decide if it matters or not.
Tire tests are done driving at the limit. Of course in normal-everyday drive all the tires would be almost equal. It's in emergencies when the tire you have matters, than those 5% between the best and worst can mean accident/injury or forgetting about the incident next week if nothing happened.
But it's ridiculous to score tires on attributes when the differences are so small. It would make more sense to put tires into similar abilities in each test. Tire tests should point out where there are significant shortfalls in a particular area. Auto Express did this in its last group test. Any graph with a false origin is either intended to deceive or an insult to its readers.
All season tires are inevitably a compromise. It's important to find where the manufacturer has sacrificed one ability to enhance another. I'm willing to lose some snow traction to get better wet grip. But a diference of 5% or less is of no consequence. I will never drive on the limit. In poor driving conditions I leave a large gap between me and vehicles in front. And when some moron tailgates me, I leave additional braking space so that I can brake gently if the car infront explodes or somersaults.
As Igor mentioned, it's rare to find graphs starting at 0 when there's such a small spread of results as consuming the data is too difficult on smaller screens.
Please can you explain your point about Auto Express more? Also express simply take the braking distances, make the best 100% then each one after that is a percentage of the 100% result. This means in things like dry braking you have 8 tires all within 4% of each other, which is just as meaningful as 8 tires within 2 meters of each other!
4% is a small difference. 2 meterrs is half the width of the graph and this looks a large difference. The noise differeces look significant but 3dB is the smallest change detectable by humans!
Here's my version of AutoBild's 225/50R17 test
https://drive.google.com/op...
4% is quite a small difference, but 2 meters is a third the width of the graph. The noise differences look quite big, but 3dB is only just noticeable to the human ear.
My version of AutoBild's 225/50R17 tests is here.....
https://disq.us/url?url=htt...
While I understand your point, your version of the graph is too difficult to see the differences between the results. The way the site generates the graph is actually fairly standard, with many of the magazines publishing their tables with non-zero indexes too.
This made me laugh!
" your version of the graph is too difficult to see the differences between the results."
That's exactly my point when the differences are a bit trivial, let's say 5% or less, even 10%.
But let's agree to differ :-)
I completely agree with kelper.
For my sins, I teach medical students in university on critical appraisal of statistics.
Truncation of the graph axis, as done here, is generally considered to produce misleading interpretations by exaggerating the differences between products. A typical example is an expensive new drug which is only slightly better than the cheap old drug. But the graph can be drawn in a way that makes the expensive drug seem a whole lot better.
Lots of articles on the web explaining misleading graphs, and how to overcome this by showing the entire axis and/or axis breaks.
https://en.wikipedia.org/wi...
https://venngage.com/blog/m...
I do think this is a great tire review site and I value the advice. But I don't look at graphs.
3db is double the noise so i would think you would definitely hear a difference.
3dB is double the sound energy. It takes ten times the sound energy for a perceived doubling in noise. I think 1dB change is perceptible in lab conditions. But if two cars passed you and the measured sounds were less than 3dB, most people could not, reliably, say which was louder. If you are interested you can test this yourself at http://www.audiocheck.net/b...
For a steady tone I could not hear the 1dB rise or fall. But the washing machine is on behind me and I have some high trequncy hearing loss from years in ship's engine rooms.
look here for evidence http://www.autoexpress.co.u...
There is no info of tire size tested.
Considering the tire models, should I suppose its 225/45R17
Sorry, and very good guess! Article updated :)