




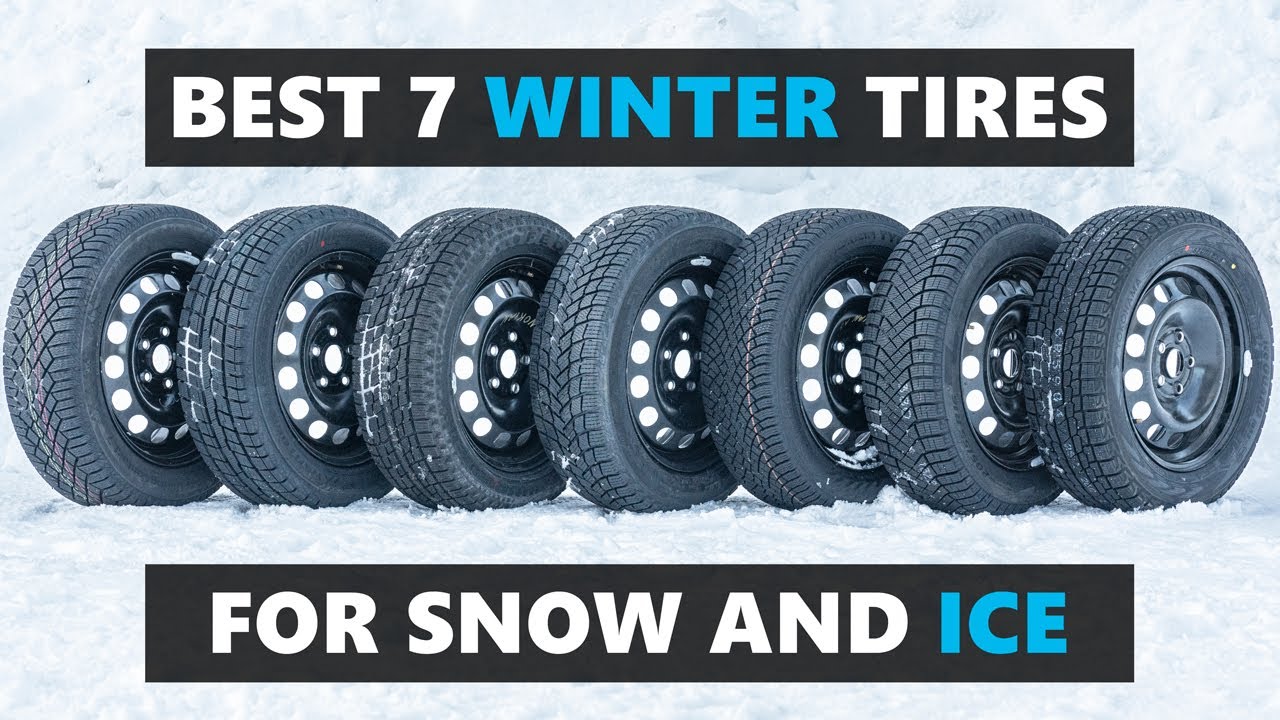
Snow tires, studless friction tires, extreme winter tires, nordic winter tires. This category of tire goes by many names, and they have one design goal, to be the very best on snow and ice for harsh winter climates, where studded tires aren't appropriate, or for people who don't want studs.
To find out which is the best, Tire Reviews has taken 7 of the most popular tires available to both the North American and Nordic markets, and will be putting them through a full range of tests, including ice, snow, wet and dry testing to find out which is best at what. Also, to help you understand where these tires fit in the market, I'm also including the very best of the central european and studded winter tires, the Continental WinterContact TS870 and the studded Nokian Happapelliita 10.
Test setup & methodology
The test setting, the conditions recorded and how the results contribute to the score.
Show full testing methodology
Recorded test conditions
- Dry Braking
- 62.1 → 3.1 mph
- Wet Braking
- 49.7 → 3.1 mph
- Snow Braking
- 24.9 → 3.1 mph
- Ice Braking
- 12.4 → 3.1 mph
- Ice Traction
- 3.1 → 12.4 mph
Score Weighting
Weights express the scoring priorities, not how much each discipline actually changed the finishing order. The size of the performance gaps matters too. Category weights contribute to the overall score. Within each category, discipline weights divide that category’s share. Published finishing positions also need to be read alongside the editorial verdict.
| Test | Within category | Share of overall score |
|---|---|---|
| Dry · 10% | ||
| Dry Braking | 55% | 5.5% |
| Dry Handling | 40% | 4% |
| Subj. Dry Handling | 5% | 0.5% |
| Wet · 15% | ||
| Wet Braking | 50% | 7.5% |
| Wet Handling | 25% | 3.75% |
| Subj. Wet Handling | 5% | 0.75% |
| Straight Aqua | 15% | 2.25% |
| Curved Aquaplaning | 5% | 0.75% |
| Snow · 30% | ||
| Snow Braking | 52.9% | 15.88% |
| Snow Traction | 11.8% | 3.53% |
| Snow Handling | 29.4% | 8.82% |
| Subj. Snow Handling | 5.9% | 1.76% |
| Ice · 30% | ||
| Ice Braking | 40% | 12% |
| Ice Traction | 30% | 9% |
| Ice Handling | 25% | 7.5% |
| Subj. Ice Handling | 5% | 1.5% |
| Comfort · 5% | ||
| Subj. Comfort | 50% | 2.5% |
| Noise | 50% | 2.5% |
| Value · 10% | ||
| Rolling Resistance | 100% | 10% |
Our standard methods
The conditions above are recorded for this test. The descriptions below explain our standard procedures; measurement windows and run counts can vary by test.
Dry Braking
For dry braking, I drive the test vehicle at an entry speed of 110 km/h and apply full braking effort to a standstill with ABS active on clean, dry asphalt. I typically use an 100–5 km/h measurement window. My standard programme is five runs per tire set where possible, although the sequence can extend to as many as fifteen runs if conditions and tire category justify it. I analyze the full set of runs and discard statistical outliers before averaging. Reference tires are run repeatedly throughout the session to correct for changing conditions.
Dry Handling
For dry handling, I drive at the limit of adhesion around a dedicated handling circuit with ESC disabled where possible so I can assess the tire's natural balance, transient response, and limit behavior without electronic intervention masking the result. I usually complete between two and five timed laps per tire set, depending on the circuit, tire type, and consistency of conditions. I exclude laps affected by clear driver error or obvious environmental inconsistency. Control runs are carried out frequently throughout the session, and I often use multiple sets of control tires so that wear on the references does not become a meaningful variable. For more track-focused products, I also do endurance testing, which is a set number of laps at race pace to determine tire wear patterns and heat resistance over longer driving.
Subj. Dry Handling
I also carry out a structured subjective handling assessment at the limit of adhesion on a dedicated dry handling circuit. I score steering precision, steering response, turn-in behavior, mid-corner balance, corner-exit traction, breakaway characteristics, and overall confidence using a standardised 1–10 scale used consistently across my testing. The final assessment combines numeric scoring with written technical commentary. I complete familiarisation laps on the control tire before evaluating each candidate.
Wet Braking
For wet braking, I drive the test vehicle at an entry speed of 88 km/h and apply full braking effort to a standstill with ABS active on an asphalt surface with a controlled water film. I typically use an 80–5 km/h measurement window to isolate tire performance from variability in the initial brake application. My standard programme is eight runs per tire set where possible, although the sequence can extend to as many as fifteen runs if conditions and tire category justify it. I analyze the full set of runs and discard statistical outliers before averaging. To correct for changing conditions, I run reference tires repeatedly throughout the session — in wet testing, typically every three candidate test sets.
Wet Handling
For wet handling, I drive at the limit of adhesion around a dedicated handling circuit. I generally use specialist wet circuits with kerb-watering systems designed to maintain a consistent surface condition. ESC is disabled where possible so I can assess the tire's natural balance, transient response, and limit behavior without electronic intervention masking the result. I usually complete between two and five timed laps per tire set, depending on the circuit, tire type, and consistency of conditions. I exclude laps affected by clear driver error or obvious environmental inconsistency. Control runs are carried out frequently throughout the session, and I often use multiple sets of control tires so that wear on the references does not become a meaningful variable.
Subj. Wet Handling
I also carry out a structured subjective handling assessment at the limit of adhesion on a dedicated wet handling circuit. I score steering precision, steering response, turn-in behavior, mid-corner balance, aquaplaning resistance, breakaway characteristics, and overall confidence using a standardised 1–10 scale used consistently across my testing. The final assessment combines numeric scoring with written technical commentary. I complete familiarisation laps on the control tire before evaluating each candidate.
Straight Aqua
To measure straight-line aquaplaning resistance, I drive one side of the vehicle through a water trough of controlled depth, typically around 7 mm, while the opposite side remains on dry pavement. I enter at a fixed speed and then accelerate progressively. I define aquaplaning onset as the point at which the wheel travelling through the water exceeds a specified slip threshold relative to the dry-side reference wheel. I usually perform four runs per tire set and average the valid results.
Curved Aquaplaning
For curved aquaplaning, I use a circular track, typically around 100 meters in diameter, with a flooded arc of controlled water depth, usually about 7 mm. The vehicle is instrumented with GPS telemetry and a tri-axial accelerometer. I drive through the flooded section at progressively increasing speed, typically in 5 km/h increments, and record the minimum sustained lateral acceleration at each step. The test continues until lateral acceleration collapses, indicating complete aquaplaning. The result is expressed as remaining lateral acceleration in m/s² as speed rises.
Snow Braking
For snow braking, I drive the test vehicle at an entry speed of 50 km/h and apply full braking effort to a standstill with ABS active on a groomed, compacted snow surface, measuring 45-5 km/h. I generally use a wide VDA (vehicle dynamic area) and progressively move across the surface between runs so that no tire ever brakes on the same piece of snow twice. My standard programme is twelve runs per tire set, although the sequence can extend further if the data justify it. I analyze the full set of runs and discard statistical outliers before averaging. The surface is regularly groomed throughout the session. To correct for changing snow surface conditions, I run reference tires repeatedly — typically every two candidate test sets.
Snow Traction
For snow traction, I accelerate the vehicle from rest on a groomed snow surface with traction control active and measure speed and time using GPS telemetry. I typically use a 5–35 km/h measurement window to reduce the influence of launch transients and powertrain irregularities. I use a wide VDA (vehicle dynamic area) and progressively move across the surface between runs so that no tire ever accelerates on the same piece of snow twice. The surface is regularly groomed throughout the session. I complete multiple runs per tire set and average the valid results. Reference tires are run typically every two candidate test sets to correct for changing snow surface conditions.
Snow Handling
For snow handling, I drive at the limit of adhesion around a dedicated snow handling circuit with ESC disabled where possible. The circuit is groomed and prepared after every run while tires are being changed, so each set runs on a consistently prepared surface. I usually complete between two and five timed laps per tire set, excluding laps affected by clear driver error or obvious environmental inconsistency. Because snow surfaces degrade more rapidly than asphalt, control runs are carried out more frequently — typically every two candidate test sets.
Subj. Snow Handling
I also carry out a structured subjective handling assessment at the limit of adhesion on a dedicated snow handling circuit. The circuit is groomed and prepared after every run while tires are being changed, so each set runs on a consistently prepared surface. I score steering precision, turn-in behavior, mid-corner balance, corner-exit traction, breakaway characteristics, and overall confidence on snow using a standardised 1–10 scale used consistently across my testing. The final assessment combines numeric scoring with written technical commentary. I complete familiarisation laps on the control tire before evaluating each candidate.
Snow Circle
For snow lateral grip testing, I use a circular snow track of fixed radius, broadly aligned with ISO 4138 principles. The surface is regularly groomed throughout the session. I progressively increase speed until the maximum sustainable cornering speed is reached. I normally record multiple laps in both clockwise and counterclockwise directions to reduce the influence of surface bias. Because snow surfaces degrade more rapidly, the control tire is retested at regular intervals and I often use multiple sets of control tires.
Ice Braking
For ice braking, I drive the test vehicle at an entry speed of 35 km/h and apply full braking effort to a standstill with ABS active on a prepared ice surface. Surface temperature is continuously monitored as ice friction properties vary substantially with temperature. My standard programme is twelve runs per tire set but with ice testing, you often do many more. I analyze the full set of runs and discard statistical outliers before averaging. Reference tires are run typically every two candidate test sets to correct for changing surface conditions.
Ice Traction
For ice traction, I accelerate the vehicle from rest on a prepared ice surface with traction control active and measure speed and time using GPS telemetry. I typically use a 5–35 km/h measurement window to reduce the influence of launch transients. I use a wide VDA (vehicle dynamic area) and progressively move across the surface between runs so that no tire ever accelerates on the same piece of ice twice. Surface temperature is continuously monitored. I complete multiple runs per tire set and average the valid results, with reference tires run typically every two candidate test sets.
Ice Handling
For ice handling, I drive at the limit of adhesion around a dedicated ice handling circuit with ESC disabled where possible. I usually complete between two and five timed laps per tire set, excluding laps affected by clear driver error or obvious environmental inconsistency. Surface temperature is continuously monitored. Control runs are carried out frequently — typically every two candidate test sets — to account for changing ice surface conditions.
Subj. Ice Handling
I also carry out a structured subjective handling assessment on a prepared ice circuit. I score steering response, predictability, grip progression, breakaway characteristics, and overall confidence on ice using a standardised 1–10 scale used consistently across my testing. Surface temperature is monitored throughout. The final assessment combines numeric scoring with written technical commentary.
Subj. Comfort
To assess comfort, I drive on a wide range of road surfaces (often dedicated comfort tracks at test facilities) at speeds from 50 to 120 km/h, including smooth motorway, coarse surfaces, expansion joints, broken pavement, and sharp-edged obstacles. I evaluate primary ride quality, secondary ride quality, impact harshness, seat-transmitted vibration, and the tire's ability to absorb sharp inputs. Ratings are assigned on a 1–10 scale relative to the reference tire.
Noise
For cabin noise assessment, I drive at controlled speeds, typically 50, 80, 100, and 120 km/h, on NVH test surfaces with defined texture characteristics. Calibrated microphones are positioned at ear height within the cabin. Measurements are taken using A-weighting, with one-third octave analysis where required to identify tonal features such as cavity resonance. Windows remain closed, ventilation is off, and ambient conditions are controlled so the data reflects the tire rather than external interference.
Rolling Resistance
Rolling resistance is measured under controlled laboratory conditions in accordance with ISO 28580 and UNECE Regulation 117 Annex 6. The tire is mounted on a test wheel and loaded against a large-diameter steel drum. After thermal stabilisation at the prescribed test speed, rolling resistance force is measured at the spindle and corrected according to the relevant procedure. The result is expressed as rolling resistance coefficient, typically in kg/tonne.
Ice
Fortunately all the tires performed well during ice handling, apart from maybe the Federal which was over 10% off the best, and just had a lot of understeer, especially on throttle, but still impressive grip on this semi rough ice.

Yokohama, Cooper and Pirelli were next, all three tires having good levels of grip, but you had to be extra careful with all your inputs, instead of the regular amounts of careful ice demands.
The top three, all within a few percent of each other, were Nokian, Michelin and Continental.
The Conti was the fastest, it had excellent levels of grip, but of the three it was the most peaky, meaning the grip fell off a little bit faster. The Michelin was my favorite of all the tires to drive as it felt like it had the best turn in and grip when trying to do more than one thing at the front, but the Nokian was a very close, impressive second, both these tires were the most predictable and balanced and lovely.
As for the two reference tires, the Central European Continental WinterContact TS870, wow, what an impressive tire. Yes it was the slowest, but not THAT much slower than the worst nordic winter tire, and it was easy and friendly to drive. The studded tire felt really great on the brakes, but I was finding quite a lot of understeer mid corner so it didn't have the advantage it should. This is a multiple test winning studded winter tire, so it just goes to show how advanced these friction winter tires are, especially on rough ice.
Ice Handling
Ice handling time in seconds
Lower is better ↓| Position / Tire | Result | Gap to best |
|---|---|---|
| 52.17 s | Best | |
| 52.92 s | +0.75 s | |
| 53.5 s | +1.33 s | |
| 54.18 s | +2.01 s | |
RefNokian Hakkapeliitta 10 |
54.33 s | +2.16 s |
| 54.63 s | +2.46 s | |
| 54.74 s | +2.57 s | |
| 58.28 s | +6.11 s | |
RefContinental WinterContact TS 870 |
59.99 s | +7.82 s |
The difference between best and worst was 15% (7.82 s).
Ice traction and braking brought back the advantage to the studded Hakkapeliitta 10 which had a huge advantage on the smooth ice. This really highlights how impressive studded tires are in the most difficult conditions.
Ice Traction
Ice acceleration time (3 - 12 mph)
Lower is better ↓| Position / Tire | Result | Gap to best |
|---|---|---|
RefNokian Hakkapeliitta 10 |
3.23 s | -2.83 s |
| 6.06 s | Best | |
| 6.1 s | +0.04 s | |
| 6.12 s | +0.06 s | |
| 6.41 s | +0.35 s | |
| 6.51 s | +0.45 s | |
| 7.92 s | +1.86 s | |
RefContinental WinterContact TS 870 |
9.13 s | +3.07 s |
| 9.18 s | +3.12 s |
The difference between best and worst was 184.2% (5.95 s).
Ice Braking
Ice braking in feet (12 - 3 mph)
Lower is better ↓| Position / Tire | Result | Gap to best | Residual speed |
|---|---|---|---|
RefNokian Hakkapeliitta 10 |
25 ft | -8 ft | 0 mph |
| 33 ft | Best | 0 mph | |
| 33 ft | 0 ft | 5 mph | |
| 34 ft | +1 ft | 11 mph | |
| 35 ft | +2 ft | 18 mph | |
| 36 ft | +3 ft | 22 mph | |
| 39 ft | +6 ft | 31 mph | |
| 42 ft | +9 ft | 36 mph | |
RefContinental WinterContact TS 870 |
42 ft | +9 ft | 36 mph |
The difference between best and worst was 65.1% (17 ft ≈ 1.1 Car Lengths). From 80 mph, the Federal Himalaya ICEO would still be travelling at 36 mph when the Michelin X Ice Snow had stopped.
Residual speed is calculated from the measured braking distances, assuming constant deceleration; it is not a separate measurement.
Snow
Once again during snow handling, none of these tires were really bad. Yokohama, Cooper and Federal were at the back, because shockingly, they had less grip than the rest. This meant you just had to do everything more slowly, steering, throttle, cornering, with the Cooper and Federal having the most understeer of all the tires.

The top 4 were all within 1% of each other, with the order being Michelin, Continental, Pirelli and Nokian the fastest.
Like on ice, the Conti was a small amount more difficult to drive as the transition from grip to sliding was more abrupt, but we're talking very small amounts. If I had to pick one to drive just on snow, it would be the Pirelli as it was a tire that felt like it willed you around the lap, or the Nokian, or the Michelin. This Golf 8 test car makes separating things really hard.
The CE TS870 again managed to pretty much match the best extreme winter tire on test, which is very impressive again as I think this is going to do very well in the dry and wet, and the studded tire pretty much matched the Nordic Nokian, which means Nokian technically won this test twice.
Snow Handling
Snow handling time in seconds
Lower is better ↓| Position / Tire | Result | Gap to best |
|---|---|---|
RefNokian Hakkapeliitta 10 |
87.73 s | -0.07 s |
| 87.8 s | Best | |
| 88 s | +0.20 s | |
| 88.08 s | +0.28 s | |
| 88.56 s | +0.76 s | |
| 89.24 s | +1.44 s | |
| 89.87 s | +2.07 s | |
| 90.99 s | +3.19 s | |
RefContinental WinterContact TS 870 |
92.12 s | +4.32 s |
The difference between best and worst was 5% (4.39 s).
Snow traction had the Nokian once again leading the group, with the Central European winter tire actually beating three of the studless friction tires!
Snow Traction
Snow acceleration time
Lower is better ↓| Position / Tire | Result | Gap to best |
|---|---|---|
| 5.55 s | Best | |
| 5.62 s | +0.07 s | |
| 5.63 s | +0.08 s | |
RefNokian Hakkapeliitta 10 |
5.64 s | +0.09 s |
| 5.66 s | +0.11 s | |
RefContinental WinterContact TS 870 |
5.85 s | +0.30 s |
| 5.92 s | +0.37 s | |
| 5.92 s | +0.37 s | |
| 6.03 s | +0.48 s |
The difference between best and worst was 8.6% (0.48 s).
The Yokohama stopped the car extremely well, leading snow braking.
Snow Braking
Snow braking in feet (25 - 3 mph)
Lower is better ↓| Position / Tire | Result | Gap to best | Residual speed |
|---|---|---|---|
| 50 ft | Best | 0 mph | |
RefNokian Hakkapeliitta 10 |
51 ft | +1 ft | 7 mph |
| 51 ft | +1 ft | 8 mph | |
| 51 ft | +1 ft | 10 mph | |
| 52 ft | +2 ft | 12 mph | |
| 52 ft | +2 ft | 13 mph | |
| 52 ft | +2 ft | 14 mph | |
| 52 ft | +2 ft | 15 mph | |
RefContinental WinterContact TS 870 |
52 ft | +2 ft | 16 mph |
The difference between best and worst was 4.1% (2 ft). From 80 mph, the Pirelli Ice Zero FR would still be travelling at 15 mph when the Yokohama iceGUARD iG53 had stopped.
Residual speed is calculated from the measured braking distances, assuming constant deceleration; it is not a separate measurement.
Like snow handling, snow circle was another double win for Nokian.
Snow Circle
Snow Circle Time in Seconds
Lower is better ↓| Position / Tire | Result | Gap to best |
|---|---|---|
RefNokian Hakkapeliitta 10 |
28.9 S | -0.08 S |
| 28.98 S | Best | |
| 29.09 S | +0.11 S | |
| 29.21 S | +0.23 S | |
RefContinental WinterContact TS 870 |
29.33 S | +0.35 S |
| 29.49 S | +0.51 S | |
| 29.94 S | +0.96 S | |
| 30.15 S | +1.17 S | |
| 30.35 S | +1.37 S |
The difference between best and worst was 5% (1.45 S).

Wet

Even though these tires are going to see a lot of snow and ice, the wet grip is still very important. Of the seven, Cooper was the slowest of the group and was difficult to drive with limited grip in all directions. Yokohama was the next slowest, this was the only tire that made the VW Golf have a loose rear end and while the oversteer was fun, it wasn't what I'd call the best balance for the road. Federal was fifth, it felt like it had much better grip than the previous two, but the steering was a bit vague, while the Nokian in fourth had a great balance and what felt like good grip, but it was one of only two tires that felt like it was aquaplaning in parts during the wet handling lap which was costing it time. The top three were very close, and were formed of Pirelli, Michelin and Continental. All three of these tires were a joy to drive, if I had to give it to one it would be the Michelin by the smallest of margins in terms of balance and steering reactions, however the Continental clearly had the most grip as it was the fastest, all while having the same micro aquaplaning issues that slowed down the Nokian!
Wet Handling
Wet handling time in seconds
Lower is better ↓| Position / Tire | Result | Gap to best |
|---|---|---|
RefContinental WinterContact TS 870 |
74.29 s | -6.51 s |
| 80.8 s | Best | |
| 81.55 s | +0.75 s | |
| 82.65 s | +1.85 s | |
| 83.2 s | +2.40 s | |
| 83.5 s | +2.70 s | |
| 84.16 s | +3.36 s | |
| 85.41 s | +4.61 s |
The difference between best and worst was 15% (11.12 s).
The all important wet braking test was led by Federal, with the Continental, Nokian and Michelin all performing well. I'm really not sure how the federal jumped up the order here, I knew what I was on when doing the braking test and it was definitely this good in braking, so gotta respect that result. Even if it is at odds with the rest of the tests.
Wet Braking
Wet braking in feet (50 - 3 mph)
Lower is better ↓| Position / Tire | Result | Gap to best | Residual speed |
|---|---|---|---|
RefContinental WinterContact TS 870 |
85 ft | -25 ft | 0 mph |
| 110 ft | Best | 0 mph | |
| 115 ft | +5 ft | 16 mph | |
| 116 ft | +6 ft | 17 mph | |
| 117 ft | +7 ft | 19 mph | |
| 118 ft | +8 ft | 20 mph | |
| 124 ft | +14 ft | 27 mph | |
| 127 ft | +17 ft | 29 mph |
The difference between best and worst was 50.2% (42 ft ≈ 2.9 Car Lengths). From 80 mph, the Yokohama iceGUARD iG53 would still be travelling at 29 mph when the Federal Himalaya ICEO had stopped.
Residual speed is calculated from the measured braking distances, assuming constant deceleration; it is not a separate measurement.
The aquaplaning tests backed up my subjective feelings with the Nokian and Continental having the worst performance over the straight and curved tests, with the Michelin proving best in both deep water tests. This is impressive considering the Michelin did so well in wet handling and in my head this will be good for slush, though I don't actually know that.
Straight Aqua
Float Speed in mph
Higher is better ↑| Position / Tire | Result | Gap to best |
|---|---|---|
RefContinental WinterContact TS 870 |
61.8 mph | +12.0 mph |
| 49.8 mph | Best | |
| 49.5 mph | -0.3 mph | |
| 47.5 mph | -2.3 mph | |
| 47.2 mph | -2.6 mph | |
| 47.0 mph | -2.8 mph | |
| 46.7 mph | -3.1 mph | |
| 44.4 mph | -5.4 mph |
The difference between best and worst was 28.1% (17.4 mph).
If you've been looking at the data you may have noticed two things about the reference tires. Firstly, there was no data for the studded tire, that's because the test facility I conducted the braking and handling didn't allow studded tires on their tracks due to damage, which I totally respect. But more importantly you should have noticed that the central european Continental Wintercontact TS870 absolutely owned the wet grip tests. It wasn't even close! I actually wrote in my notes when testing "This is how I imagine most people imagine going from road tires to slicks, only it's a bigger difference. And it's a winter tire!"
Dry

The dry handling data almost perfectly matched dry braking, so I'll summarize them together. The Continental was the best in both handling and braking with the Pirelli close behind it in terms of grip and subjective handling. The Nokian was excellent around the dry handling lap and fourth in braking, closely followed by the Michelin.
Like in the wet the Federal, Yokohama and Cooper were the slowest over the lap with the Federal being particularly difficult to drive, and like in the wet the Federal was much better in dry braking than dry handling.
If I've done my job properly, by this point it should be no surprise that the CE winter tire held its wet advantage in the dry too, though not as vast, but it was certainly noticeable, especially in braking.
Dry Handling
Dry handling time in seconds
Lower is better ↓| Position / Tire | Result | Gap to best |
|---|---|---|
RefContinental WinterContact TS 870 |
71.03 s | -1.57 s |
| 72.6 s | Best | |
| 72.88 s | +0.28 s | |
| 72.96 s | +0.36 s | |
| 73.01 s | +0.41 s | |
| 73.15 s | +0.55 s | |
| 73.31 s | +0.71 s | |
| 73.8 s | +1.20 s |
The difference between best and worst was 3.9% (2.77 s).
Dry Braking
Dry braking in feet (62 - 3 mph)
Lower is better ↓| Position / Tire | Result | Gap to best | Residual speed |
|---|---|---|---|
RefContinental WinterContact TS 870 |
135 ft | -15 ft | 0 mph |
| 150 ft | Best | 0 mph | |
| 153 ft | +3 ft | 10 mph | |
| 154 ft | +4 ft | 12 mph | |
| 156 ft | +6 ft | 15 mph | |
| 157 ft | +7 ft | 16 mph | |
| 162 ft | +12 ft | 22 mph | |
| 162 ft | +12 ft | 22 mph |
The difference between best and worst was 19.9% (27 ft ≈ 1.8 Car Lengths). From 80 mph, the Yokohama iceGUARD iG53 would still be travelling at 22 mph when the Continental VikingContact 7 had stopped.
Residual speed is calculated from the measured braking distances, assuming constant deceleration; it is not a separate measurement.
Noise and Comfort
What about noise and comfort? The Nokian and Continental led the way in the internal noise measurements, with the CE winter tire joint third with Michelin. The Nokian was also the most comfortable subjectively, tying for points with the far noiser Federal and Yokohama so if you want a quiet and comfortable tire, the Nokian excels.
Noise
Internal noise in dB
Lower is better ↓| Position / Tire | Result | Gap to best |
|---|---|---|
| 61.9 dB | Best | |
| 61.9 dB | Best | |
| 62.1 dB | +0.20 dB | |
RefContinental WinterContact TS 870 |
62.1 dB | +0.20 dB |
| 62.7 dB | +0.80 dB | |
| 62.9 dB | +1.00 dB | |
| 63.3 dB | +1.40 dB | |
| 63.4 dB | +1.50 dB |
All the tires in the Noise test finished less than 3% apart.
Subj. Comfort
Subjective Comfort Score
Higher is better ↑| Position / Tire | Result | Gap to best |
|---|---|---|
| 100 Points | Best | |
| 100 Points | Best | |
| 100 Points | Best | |
| 95 Points | -5.00 Points | |
| 95 Points | -5.00 Points | |
RefContinental WinterContact TS 870 |
95 Points | -5.00 Points |
| 95 Points | -5.00 Points | |
| 90 Points | -10.00 Points |
The difference between best and worst was 10% (10 Points).
Environment
The rolling resistance of the top four performing tires was only split by 4% which is a pretty insignificant difference in fuel use, maybe around 1% in the real world.
The next group of tires dropped 15% from the best and the Federal was 32% behind, which you would certainly notice. Again, it was Michelin, Nokian and Continental leading the way with the lowest rolling resistances, with Yokohama sliding into the front running group.
Rolling Resistance
Rolling resistance in kg t
Lower is better ↓| Position / Tire | Result | Gap to best | Extra fuel / year |
|---|---|---|---|
| 7.25 kg/t | Best | $0 | |
| 7.34 kg/t | +0.09 kg/t | $4 | |
| 7.5 kg/t | +0.25 kg/t | $10 | |
| 7.56 kg/t | +0.31 kg/t | $13 | |
RefContinental WinterContact TS 870 |
8.02 kg/t | +0.77 kg/t | $31 |
RefNokian Hakkapeliitta 10 |
8.29 kg/t | +1.04 kg/t | $42 |
| 8.38 kg/t | +1.13 kg/t | $46 | |
| 8.45 kg/t | +1.20 kg/t | $49 | |
| 10.54 kg/t | +3.29 kg/t | $133 |
The difference between best and worst was 45.4% (3.29 kg / t). Over 12,000 miles a year at $3.60/gal, the Federal Himalaya ICEO uses about 37 gal ($133) more fuel than the Michelin X Ice Snow.
Adjust the assumptions
Calculated estimates, not additional measurements. Use the controls to explore the assumptions.
Results
For the overall results I'm going to use a score weighting which matches these tires intended use, IE heavily in favor of the snow and ice performance of the tires. If you want to use a different score weighting you can now alter this to your own taste using the link below.
Continental VikingContact 7
205/55 R16 94T XL
Category scores (% of best)
All discipline results (20)
Discipline positions compare the ranked tires in this test, not the whole market. These are individual measurements, not weighted overall scores.
| Test | Position in discipline | Result | Gap to best |
|---|---|---|---|
| Dry BrakingLower is better | 1st / 7 | 150 ft | Best in this discipline |
| Dry HandlingLower is better | 1st / 7 | 72.6 s | Best in this discipline |
| Subj. Dry HandlingHigher is better | 1st / 7 | 100 Points | Best in this discipline |
| Wet BrakingLower is better | 2nd / 7 | 115 ft | +5 ft |
| Wet HandlingLower is better | 1st / 7 | 80.8 s | Best in this discipline |
| Subj. Wet HandlingHigher is better | 2nd / 7 | 95 Points | -5.00 Points |
| Straight AquaHigher is better | 6th / 7 | 46.7 mph | -3.1 mph |
| Curved AquaplaningHigher is better | 6th / 7 | 190.6 ft/s² | -18.7 ft/s² |
| Snow BrakingLower is better | 3rd / 7 | 51 ft | +1 ft |
| Snow TractionLower is better | 2nd / 7 | 5.62 s | +0.07 s |
| Snow HandlingLower is better | 3rd / 7 | 88.08 s | +0.28 s |
| Subj. Snow HandlingHigher is better | 2nd / 7 | 95 Points | -5.00 Points |
| Snow CircleLower is better | 4th / 7 | 29.49 S | +0.51 S |
| Ice BrakingLower is better | 3rd / 7 | 34 ft | +1 ft |
| Ice TractionLower is better | 2nd / 7 | 6.1 s | +0.04 s |
| Ice HandlingLower is better | 1st / 7 | 52.17 s | Best in this discipline |
| Subj. Ice HandlingHigher is better | 2nd / 7 | 95 Points | -5.00 Points |
| Subj. ComfortHigher is better | 4th / 7 | 95 Points | -5.00 Points |
| NoiseLower is better | 1st / 7 | 61.9 dB | Best in this discipline |
| Rolling ResistanceLower is better | 4th / 7 | 7.56 kg/t | +0.31 kg/t |
- Weight
- 9.2 kgs
- Tread
- 8.2 mm
Michelin X Ice Snow
205/55 R16 94H XL
Category scores (% of best)
All discipline results (20)
Discipline positions compare the ranked tires in this test, not the whole market. These are individual measurements, not weighted overall scores.
| Test | Position in discipline | Result | Gap to best |
|---|---|---|---|
| Dry BrakingLower is better | 5th / 7 | 157 ft | +7 ft |
| Dry HandlingLower is better | 4th / 7 | 73.01 s | +0.41 s |
| Subj. Dry HandlingHigher is better | 3rd / 7 | 98 Points | -2.00 Points |
| Wet BrakingLower is better | 4th / 7 | 117 ft | +7 ft |
| Wet HandlingLower is better | 2nd / 7 | 81.55 s | +0.75 s |
| Subj. Wet HandlingHigher is better | 1st / 7 | 100 Points | Best in this discipline |
| Straight AquaHigher is better | 1st / 7 | 49.8 mph | Best in this discipline |
| Curved AquaplaningHigher is better | 1st / 7 | 209.3 ft/s² | Best in this discipline |
| Snow BrakingLower is better | 5th / 7 | 52 ft | +2 ft |
| Snow TractionLower is better | 4th / 7 | 5.66 s | +0.11 s |
| Snow HandlingLower is better | 4th / 7 | 88.56 s | +0.76 s |
| Subj. Snow HandlingHigher is better | 2nd / 7 | 95 Points | -5.00 Points |
| Snow CircleLower is better | 2nd / 7 | 29.09 S | +0.11 S |
| Ice BrakingLower is better | 1st / 7 | 33 ft | Best in this discipline |
| Ice TractionLower is better | 3rd / 7 | 6.12 s | +0.06 s |
| Ice HandlingLower is better | 2nd / 7 | 52.92 s | +0.75 s |
| Subj. Ice HandlingHigher is better | 1st / 7 | 100 Points | Best in this discipline |
| Subj. ComfortHigher is better | 4th / 7 | 95 Points | -5.00 Points |
| NoiseLower is better | 3rd / 7 | 62.1 dB | +0.20 dB |
| Rolling ResistanceLower is better | 1st / 7 | 7.25 kg/t | Best in this discipline |
- Weight
- 9.1 kgs
- Tread
- 8.1 mm
Nokian Hakkapeliitta R5
205/55 R16 94R XL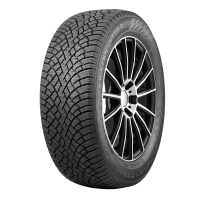
Category scores (% of best)
All discipline results (20)
Discipline positions compare the ranked tires in this test, not the whole market. These are individual measurements, not weighted overall scores.
| Test | Position in discipline | Result | Gap to best |
|---|---|---|---|
| Dry BrakingLower is better | 4th / 7 | 156 ft | +6 ft |
| Dry HandlingLower is better | 3rd / 7 | 72.96 s | +0.36 s |
| Subj. Dry HandlingHigher is better | 1st / 7 | 100 Points | Best in this discipline |
| Wet BrakingLower is better | 3rd / 7 | 116 ft | +6 ft |
| Wet HandlingLower is better | 4th / 7 | 83.2 s | +2.40 s |
| Subj. Wet HandlingHigher is better | 2nd / 7 | 95 Points | -5.00 Points |
| Straight AquaHigher is better | 7th / 7 | 44.4 mph | -5.4 mph |
| Curved AquaplaningHigher is better | 7th / 7 | 183.1 ft/s² | -26.2 ft/s² |
| Snow BrakingLower is better | 2nd / 7 | 51 ft | +1 ft |
| Snow TractionLower is better | 1st / 7 | 5.55 s | Best in this discipline |
| Snow HandlingLower is better | 1st / 7 | 87.8 s | Best in this discipline |
| Subj. Snow HandlingHigher is better | 2nd / 7 | 95 Points | -5.00 Points |
| Snow CircleLower is better | 1st / 7 | 28.98 S | Best in this discipline |
| Ice BrakingLower is better | 2nd / 7 | 33 ft | 0 ft |
| Ice TractionLower is better | 1st / 7 | 6.06 s | Best in this discipline |
| Ice HandlingLower is better | 3rd / 7 | 53.5 s | +1.33 s |
| Subj. Ice HandlingHigher is better | 2nd / 7 | 95 Points | -5.00 Points |
| Subj. ComfortHigher is better | 1st / 7 | 100 Points | Best in this discipline |
| NoiseLower is better | 1st / 7 | 61.9 dB | Best in this discipline |
| Rolling ResistanceLower is better | 2nd / 7 | 7.34 kg/t | +0.09 kg/t |
- Weight
- 8.55 kgs
- Tread
- 8.5 mm
Pirelli Ice Zero FR
205/55 R16 94T XL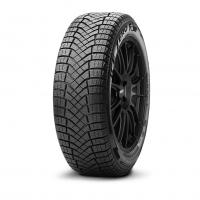
Category scores (% of best)
All discipline results (20)
Discipline positions compare the ranked tires in this test, not the whole market. These are individual measurements, not weighted overall scores.
| Test | Position in discipline | Result | Gap to best |
|---|---|---|---|
| Dry BrakingLower is better | 2nd / 7 | 153 ft | +3 ft |
| Dry HandlingLower is better | 2nd / 7 | 72.88 s | +0.28 s |
| Subj. Dry HandlingHigher is better | 3rd / 7 | 98 Points | -2.00 Points |
| Wet BrakingLower is better | 5th / 7 | 118 ft | +8 ft |
| Wet HandlingLower is better | 3rd / 7 | 82.65 s | +1.85 s |
| Subj. Wet HandlingHigher is better | 4th / 7 | 92 Points | -8.00 Points |
| Straight AquaHigher is better | 5th / 7 | 47.0 mph | -2.8 mph |
| Curved AquaplaningHigher is better | 4th / 7 | 192.6 ft/s² | -16.7 ft/s² |
| Snow BrakingLower is better | 7th / 7 | 52 ft | +2 ft |
| Snow TractionLower is better | 3rd / 7 | 5.63 s | +0.08 s |
| Snow HandlingLower is better | 2nd / 7 | 88 s | +0.20 s |
| Subj. Snow HandlingHigher is better | 1st / 7 | 100 Points | Best in this discipline |
| Snow CircleLower is better | 3rd / 7 | 29.21 S | +0.23 S |
| Ice BrakingLower is better | 4th / 7 | 35 ft | +2 ft |
| Ice TractionLower is better | 5th / 7 | 6.51 s | +0.45 s |
| Ice HandlingLower is better | 4th / 7 | 54.18 s | +2.01 s |
| Subj. Ice HandlingHigher is better | 4th / 7 | 90 Points | -10.00 Points |
| Subj. ComfortHigher is better | 4th / 7 | 95 Points | -5.00 Points |
| NoiseLower is better | 4th / 7 | 62.7 dB | +0.80 dB |
| Rolling ResistanceLower is better | 5th / 7 | 8.38 kg/t | +1.13 kg/t |
- Weight
- 9.22 kgs
- Tread
- 8.9 mm
Yokohama iceGUARD iG53
205/55 R16 91H
Category scores (% of best)
All discipline results (20)
Discipline positions compare the ranked tires in this test, not the whole market. These are individual measurements, not weighted overall scores.
| Test | Position in discipline | Result | Gap to best |
|---|---|---|---|
| Dry BrakingLower is better | 7th / 7 | 162 ft | +12 ft |
| Dry HandlingLower is better | 6th / 7 | 73.31 s | +0.71 s |
| Subj. Dry HandlingHigher is better | 5th / 7 | 95 Points | -5.00 Points |
| Wet BrakingLower is better | 7th / 7 | 127 ft | +17 ft |
| Wet HandlingLower is better | 6th / 7 | 84.16 s | +3.36 s |
| Subj. Wet HandlingHigher is better | 7th / 7 | 75 Points | -25.00 Points |
| Straight AquaHigher is better | 4th / 7 | 47.2 mph | -2.6 mph |
| Curved AquaplaningHigher is better | 3rd / 7 | 194.9 ft/s² | -14.4 ft/s² |
| Snow BrakingLower is better | 1st / 7 | 50 ft | Best in this discipline |
| Snow TractionLower is better | 5th / 7 | 5.92 s | +0.37 s |
| Snow HandlingLower is better | 7th / 7 | 90.99 s | +3.19 s |
| Subj. Snow HandlingHigher is better | 5th / 7 | 80 Points | -20.00 Points |
| Snow CircleLower is better | 7th / 7 | 30.35 S | +1.37 S |
| Ice BrakingLower is better | 5th / 7 | 36 ft | +3 ft |
| Ice TractionLower is better | 4th / 7 | 6.41 s | +0.35 s |
| Ice HandlingLower is better | 6th / 7 | 54.74 s | +2.57 s |
| Subj. Ice HandlingHigher is better | 4th / 7 | 90 Points | -10.00 Points |
| Subj. ComfortHigher is better | 1st / 7 | 100 Points | Best in this discipline |
| NoiseLower is better | 7th / 7 | 63.4 dB | +1.50 dB |
| Rolling ResistanceLower is better | 3rd / 7 | 7.5 kg/t | +0.25 kg/t |
- Weight
- 9.76 kgs
- Tread
- 8.9 mm
Cooper Weathermaster S100
205/55 R16 91T
Category scores (% of best)
All discipline results (20)
Discipline positions compare the ranked tires in this test, not the whole market. These are individual measurements, not weighted overall scores.
| Test | Position in discipline | Result | Gap to best |
|---|---|---|---|
| Dry BrakingLower is better | 6th / 7 | 162 ft | +12 ft |
| Dry HandlingLower is better | 5th / 7 | 73.15 s | +0.55 s |
| Subj. Dry HandlingHigher is better | 6th / 7 | 90 Points | -10.00 Points |
| Wet BrakingLower is better | 6th / 7 | 124 ft | +14 ft |
| Wet HandlingLower is better | 7th / 7 | 85.41 s | +4.61 s |
| Subj. Wet HandlingHigher is better | 5th / 7 | 80 Points | -20.00 Points |
| Straight AquaHigher is better | 3rd / 7 | 47.5 mph | -2.3 mph |
| Curved AquaplaningHigher is better | 2nd / 7 | 196.2 ft/s² | -13.1 ft/s² |
| Snow BrakingLower is better | 6th / 7 | 52 ft | +2 ft |
| Snow TractionLower is better | 5th / 7 | 5.92 s | +0.37 s |
| Snow HandlingLower is better | 6th / 7 | 89.87 s | +2.07 s |
| Subj. Snow HandlingHigher is better | 5th / 7 | 80 Points | -20.00 Points |
| Snow CircleLower is better | 6th / 7 | 30.15 S | +1.17 S |
| Ice BrakingLower is better | 6th / 7 | 39 ft | +6 ft |
| Ice TractionLower is better | 6th / 7 | 7.92 s | +1.86 s |
| Ice HandlingLower is better | 5th / 7 | 54.63 s | +2.46 s |
| Subj. Ice HandlingHigher is better | 6th / 7 | 85 Points | -15.00 Points |
| Subj. ComfortHigher is better | 7th / 7 | 90 Points | -10.00 Points |
| NoiseLower is better | 6th / 7 | 63.3 dB | +1.40 dB |
| Rolling ResistanceLower is better | 6th / 7 | 8.45 kg/t | +1.20 kg/t |
- Weight
- 9.88 kgs
- Tread
- 8.6 mm
Federal Himalaya ICEO
205/55 R16 91Q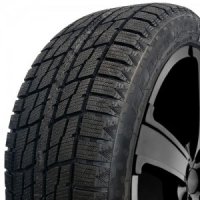
Category scores (% of best)
All discipline results (20)
Discipline positions compare the ranked tires in this test, not the whole market. These are individual measurements, not weighted overall scores.
| Test | Position in discipline | Result | Gap to best |
|---|---|---|---|
| Dry BrakingLower is better | 3rd / 7 | 154 ft | +4 ft |
| Dry HandlingLower is better | 7th / 7 | 73.8 s | +1.20 s |
| Subj. Dry HandlingHigher is better | 7th / 7 | 80 Points | -20.00 Points |
| Wet BrakingLower is better | 1st / 7 | 110 ft | Best in this discipline |
| Wet HandlingLower is better | 5th / 7 | 83.5 s | +2.70 s |
| Subj. Wet HandlingHigher is better | 5th / 7 | 80 Points | -20.00 Points |
| Straight AquaHigher is better | 2nd / 7 | 49.5 mph | -0.3 mph |
| Curved AquaplaningHigher is better | 4th / 7 | 192.6 ft/s² | -16.7 ft/s² |
| Snow BrakingLower is better | 4th / 7 | 52 ft | +2 ft |
| Snow TractionLower is better | 7th / 7 | 6.03 s | +0.48 s |
| Snow HandlingLower is better | 5th / 7 | 89.24 s | +1.44 s |
| Subj. Snow HandlingHigher is better | 7th / 7 | 75 Points | -25.00 Points |
| Snow CircleLower is better | 5th / 7 | 29.94 S | +0.96 S |
| Ice BrakingLower is better | 7th / 7 | 42 ft | +9 ft |
| Ice TractionLower is better | 7th / 7 | 9.18 s | +3.12 s |
| Ice HandlingLower is better | 7th / 7 | 58.28 s | +6.11 s |
| Subj. Ice HandlingHigher is better | 7th / 7 | 80 Points | -20.00 Points |
| Subj. ComfortHigher is better | 1st / 7 | 100 Points | Best in this discipline |
| NoiseLower is better | 5th / 7 | 62.9 dB | +1.00 dB |
| Rolling ResistanceLower is better | 7th / 7 | 10.54 kg/t | +3.29 kg/t |
- Weight
- 11.2 kgs
- Tread
- 9.1 mm
Continental WinterContact TS 870
205/55 R16 91H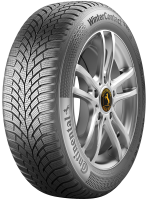
All discipline results (20)
Discipline positions compare the ranked tires in this test, not the whole market. These are individual measurements, not weighted overall scores.
| Test | Result |
|---|---|
| Dry BrakingLower is better | 135 ft |
| Dry HandlingLower is better | 71.03 s |
| Subj. Dry HandlingHigher is better | 110 Points |
| Wet BrakingLower is better | 85 ft |
| Wet HandlingLower is better | 74.29 s |
| Subj. Wet HandlingHigher is better | 120 Points |
| Straight AquaHigher is better | 61.8 mph |
| Curved AquaplaningHigher is better | 253.9 ft/s² |
| Snow BrakingLower is better | 52 ft |
| Snow TractionLower is better | 5.85 s |
| Snow HandlingLower is better | 92.12 s |
| Subj. Snow HandlingHigher is better | 80 Points |
| Snow CircleLower is better | 29.33 S |
| Ice BrakingLower is better | 42 ft |
| Ice TractionLower is better | 9.13 s |
| Ice HandlingLower is better | 59.99 s |
| Subj. Ice HandlingHigher is better | 70 Points |
| Subj. ComfortHigher is better | 95 Points |
| NoiseLower is better | 62.1 dB |
| Rolling ResistanceLower is better | 8.02 kg/t |
- Weight
- 8.15 kgs
- Tread
- 8.9 mm
Nokian Hakkapeliitta 10
205/55 R16 94T XL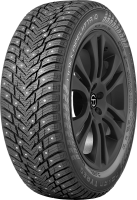
All discipline results (10)
Discipline positions compare the ranked tires in this test, not the whole market. These are individual measurements, not weighted overall scores.
| Test | Result |
|---|---|
| Snow BrakingLower is better | 51 ft |
| Snow TractionLower is better | 5.64 s |
| Snow HandlingLower is better | 87.73 s |
| Subj. Snow HandlingHigher is better | 95 Points |
| Snow CircleLower is better | 28.9 S |
| Ice BrakingLower is better | 25 ft |
| Ice TractionLower is better | 3.23 s |
| Ice HandlingLower is better | 54.33 s |
| Subj. Ice HandlingHigher is better | 90 Points |
| Rolling ResistanceLower is better | 8.29 kg/t |
- Weight
- 9.33 kgs
- Tread
- 9.1 mm
When can we see test done on minivans? I’m curious to see how these winter tires handle in a minivan or similar size vehicles (FWD). Something bigger that isn’t AWD.
Thanks for the review. Very educational! Cheers!
In theory it should translate across vehicle types
-- Performances of studded tires but without studs.--
I did saw a lot of review of winter tires but never saw any that is reviewing the Nokian Hakkapeliitta 10 that are not set with any studs. I do understands that studs clearly help for gripping on ice, but what's if there are no studs on these tires? Are they as good as the Hakkapeliitta R5, acceptable or simply not good at all?
Location Montreal
Vehicle: all wheel drive SUV
Winter Tire size: 255/55 R19
Driving under unpredictable slushy conditions is kind of my main concern during winter driving. The Hakka R5 didn't look to be a king under such conditions. Also dont want want to drive on studs.
Why wouldn't you buy the R5 if that's what you want?
Studded tires usually have a slightly harder compound so an unstudded Hakka 10 would be worse than the R5.
I live in the Northeast, and the snow we get is much wetter than what they get in the Midwest or the Pacific Northwest. Quick to become slush, studless winters are way overkill.
I am however quite curious about how these tires would perform in slushy conditions. I know you've mentioned it is difficult to test. But what would you guess?
My suspicion is that the lack of hydro performance would be detrimental. And the michelins x ice would probably beat the rest because of hydroplaning. I also suspect that an all-weather tire like the cross climate twos would dominate in slushy snow, Even better than a central European all season I would guess.
i tend to agree, but the biggest factor is what's below the snow. If you're getting through to the road surface then yet, if you're only getting to another layer of snow, then no.
Hi. What about the Nokian R5 EV compared to these non EV tires? I am struggling to find any good data on the web and would be nice to have it into this test.
Hello.
First off: thanks for the huge amount of effort required to create all this data. :-)
Second: I'd like to make a suggestion. Would it be possible to get the option of showing the graphs going down all the way to 0?
It would make it a lot easier to compare actual results. For example, in the "Dry Handling", as the graphs are now, the Continental Winter Contacts seem *infinitely* better than the worse ones (Federal Himalaya). But when we check the actual values, we find that there is only a 4% difference in performance between the best and worse. In other words, for this test, the actual difference in performance is very small.
I'm not saying that you should replace the actual graphs with graphs that go to 0, but an option to toggle between the two would be nice.
Thanks!
I like that idea :) I'm not sure it's possible with google charts which the site currently uses, but maybe it's possible with another javascript library such as chart.js or similar.
Great video. I have a set of Nokian Hakkapeliitta R2's for my GX470 but I live in North Carolina. I am thinking Central European winter tires would be more appropriate. The tough part is trying to filter through all the winter tires when they are all lumped together in most retailer websites, it would be nice with filter through them with a CE or Nordic Winter filter.
Some retailers call them "performance winter tires" but I'm afraid you might struggle to find something that fits. Maybe a good snow bias all season or all weather would be smart, something like the CC2 is great as a winter tire.
Good video, thank you, I’m always interested to see a good unbiased review. I like how you did it.
I live in Northern Ontario, Canada. I’ve run a wide range/type and brands of tires and snow tires over the years. I typically run summer and winter tires. Tire technology has changed quite a lot over the past 30-40 years in my experience.
I have become a big fan of Nokian winter tires over the past 8 years on cars and light duty SUV’s and have bought 3 sets, and will continue to do so in the future. Non studded. The traction is incredible in all conditions. And they seem to be very durable, long lasting. Work well on the highway, city and gravel roads.
As well, I know they are not covered here in this review, but I have also become a big fan of Toyo tires. The new ATIII are supposed to work well in the snow/winter and I have just installed a set on a GMC Yukon (10ply E rated) which is used on and off road, to run year round. I’ll be testing those this winter. I am interested to see how well they work in cold temps -30/40.
I actually tested the AT3s and wasn't overly impressed, though I didn't do any winter running.
https://www.tire-reviews.co...
I live in Latvia.
During winter we have both CE climate and Northern winter. Usually half and half of the winter season. So for my SUV I use AT tire with M+S thread = CE tire for the summer and I drive it untill I see, that this is safe and reasonable to use. Usually November and sometimes part or even whole December is still OK for CE tire. For the rest of the winter I change for the Friction tires. I've tried Nokian HKPL R1, Dunlop SJ6, Continental VikingContact 6 and 7. All are good, but Nokian, I think had little bit longer braking distance.
Nice little combination! Is your AT tire 3 peak rated? M+S doesn't really mean anything for snow these days!
Some of the tire performance descriptions are for the incorrect tires
Thanks, fixed.