



Following on from the 35 all season shootout, Autobild have placed the top 15 through the usual array of tests, including dry, wet and snow testing, plus they've tested wear!
Unlike the Tire Reviews test this year, they also managed to test the new Bridgestone Turanza All Season 6 and Continental AllSeasonContact 2! Can either of these new tires displace the Michelin CrossClimate 2 at the top of the results? Read on to find out!
Test setup & methodology
The test setting, the conditions recorded and how the results contribute to the score.
Recorded test conditions
Recorded test conditions
- Dry Braking
- 62.1 → 0.0 mph
- Wet Braking
- 62.1 → 0.0 mph
- Snow Braking
- 31.1 → 0.0 mph
Dry
Dry braking is where the Michelin CrossClimate 2 always performed well, and once again it is the best all season tire, 6 feet behind the summer tire, and 2 feet ahead of the second placed Kleber Quadraxer 3. The new Bridgestone finished a little behind the Kleber, but performed well.
Dry Braking
Dry braking in feet (62 - 0 mph)
Lower is better ↓| Position / Tire | Result | Gap to best | Residual speed |
|---|---|---|---|
RefReference Summer |
118 ft | -6 ft | 0 mph |
| 124 ft | Best | 0 mph | |
| 126 ft | +2 ft | 10 mph | |
| 126 ft | +2 ft | 12 mph | |
| 127 ft | +3 ft | 13 mph | |
| 128 ft | +4 ft | 14 mph | |
| 129 ft | +5 ft | 16 mph | |
| 131 ft | +7 ft | 18 mph | |
| 132 ft | +8 ft | 20 mph | |
| 133 ft | +9 ft | 21 mph | |
| 134 ft | +10 ft | 22 mph | |
| 134 ft | +10 ft | 22 mph | |
| 135 ft | +11 ft | 24 mph | |
| 136 ft | +12 ft | 24 mph | |
| 137 ft | +13 ft | 25 mph | |
| 137 ft | +13 ft | 25 mph | |
| 139 ft | +15 ft | 27 mph | |
RefReference Winter |
147 ft | +23 ft | 32 mph |
The difference between best and worst was 24.4% (29 ft ≈ 2 Car Lengths). From 80 mph, the Dunlop Sport All Season would still be travelling at 27 mph when the Michelin CrossClimate 2 had stopped.
Residual speed is calculated from the measured braking distances, assuming constant deceleration; it is not a separate measurement.
The Goodyear Vector 4Seasons Gen-3, which struggled in dry braking, performed very well in dry handling, proving to be the fastest around the lap by a significant margin. The Kleber and Michelin once again did very well.
Dry Handling
Dry Handling Average Speed
Higher is better ↑| Position / Tire | Result | Gap to best |
|---|---|---|
RefReference Summer |
56.0 mph | +0.2 mph |
| 55.8 mph | Best | |
| 55.4 mph | -0.4 mph | |
| 55.4 mph | -0.4 mph | |
| 55.3 mph | -0.5 mph | |
| 55.2 mph | -0.6 mph | |
| 55.2 mph | -0.6 mph | |
| 55.1 mph | -0.7 mph | |
| 55.0 mph | -0.8 mph | |
| 55.0 mph | -0.8 mph | |
| 54.8 mph | -1.0 mph | |
| 54.7 mph | -1.1 mph | |
| 54.6 mph | -1.2 mph | |
| 54.6 mph | -1.2 mph | |
| 54.6 mph | -1.2 mph | |
| 54.5 mph | -1.3 mph | |
| 54.4 mph | -1.4 mph | |
RefReference Winter |
52.9 mph | -2.9 mph |
The difference between best and worst was 5.5% (3.1 mph).
Wet
Bridgestone were back at the front of wet braking, something the A005 EVO used to do very well. The new Continental also performed very well, highlighting the advantage of the newest products.
Wet Braking
Wet braking in feet (62 - 0 mph)
Lower is better ↓| Position / Tire | Result | Gap to best | Residual speed |
|---|---|---|---|
RefReference Summer |
141 ft | -7 ft | 0 mph |
| 148 ft | Best | 0 mph | |
| 149 ft | +1 ft | 8 mph | |
| 149 ft | +1 ft | 8 mph | |
| 151 ft | +3 ft | 12 mph | |
| 153 ft | +5 ft | 15 mph | |
| 154 ft | +6 ft | 17 mph | |
| 156 ft | +8 ft | 18 mph | |
| 156 ft | +8 ft | 18 mph | |
| 157 ft | +9 ft | 20 mph | |
| 158 ft | +10 ft | 21 mph | |
| 159 ft | +11 ft | 21 mph | |
| 160 ft | +12 ft | 22 mph | |
RefReference Winter |
162 ft | +14 ft | 24 mph |
| 162 ft | +14 ft | 24 mph | |
| 163 ft | +15 ft | 25 mph | |
| 164 ft | +16 ft | 26 mph | |
| 166 ft | +18 ft | 27 mph |
The difference between best and worst was 17.9% (25 ft ≈ 1.7 Car Lengths). From 80 mph, the Toyo Celsius AS2 would still be travelling at 27 mph when the Bridgestone Turanza All Season 6 had stopped.
Residual speed is calculated from the measured braking distances, assuming constant deceleration; it is not a separate measurement.
The Vredestein Quatrac was the fastest around the wet handling lap by quite the margin, with the Goodyear and Bridgestone once again performing well.
Wet Handling
Wet Handling Average Speed
Higher is better ↑| Position / Tire | Result | Gap to best |
|---|---|---|
RefReference Summer |
48.0 mph | +0.7 mph |
| 47.3 mph | Best | |
| 46.5 mph | -0.8 mph | |
| 46.4 mph | -0.9 mph | |
| 46.4 mph | -0.9 mph | |
| 46.4 mph | -0.9 mph | |
RefReference Winter |
46.3 mph | -1.0 mph |
| 46.3 mph | -1.0 mph | |
| 46.3 mph | -1.0 mph | |
| 45.7 mph | -1.6 mph | |
| 45.2 mph | -2.1 mph | |
| 45.2 mph | -2.1 mph | |
| 44.8 mph | -2.5 mph | |
| 44.7 mph | -2.6 mph | |
| 44.1 mph | -3.2 mph | |
| 44.0 mph | -3.3 mph | |
| 44.0 mph | -3.3 mph | |
| 43.8 mph | -3.5 mph |
The difference between best and worst was 8.7% (4.2 mph).
There was a spread of results in the straight and curved aquaplaning tests, data below.
Straight Aqua
Float Speed in mph
Higher is better ↑| Position / Tire | Result | Gap to best |
|---|---|---|
| 50.8 mph | Best | |
| 50.0 mph | -0.8 mph | |
| 50.0 mph | -0.8 mph | |
| 49.6 mph | -1.2 mph | |
| 49.2 mph | -1.6 mph | |
RefReference Summer |
49.1 mph | -1.7 mph |
| 49.1 mph | -1.7 mph | |
| 48.8 mph | -2.0 mph | |
| 48.8 mph | -2.0 mph | |
| 47.9 mph | -2.9 mph | |
| 47.3 mph | -3.5 mph | |
| 47.3 mph | -3.5 mph | |
| 46.9 mph | -3.9 mph | |
RefReference Winter |
45.4 mph | -5.4 mph |
| 45.2 mph | -5.6 mph | |
| 45.2 mph | -5.6 mph | |
| 44.9 mph | -5.9 mph | |
| 44.4 mph | -6.4 mph |
The difference between best and worst was 12.5% (6.4 mph).
Curved Aquaplaning
Remaining lateral acceleration
Higher is better ↑| Position / Tire | Result | Gap to best |
|---|---|---|
| 11.7 ft/s² | Best | |
RefReference Summer |
11.2 ft/s² | -0.5 ft/s² |
| 11.1 ft/s² | -0.6 ft/s² | |
| 11.0 ft/s² | -0.7 ft/s² | |
| 11.0 ft/s² | -0.7 ft/s² | |
| 10.9 ft/s² | -0.8 ft/s² | |
| 10.9 ft/s² | -0.8 ft/s² | |
| 10.8 ft/s² | -0.9 ft/s² | |
| 10.7 ft/s² | -1.0 ft/s² | |
| 10.4 ft/s² | -1.3 ft/s² | |
| 10.3 ft/s² | -1.4 ft/s² | |
| 10.3 ft/s² | -1.4 ft/s² | |
| 10.0 ft/s² | -1.7 ft/s² | |
| 9.7 ft/s² | -2.0 ft/s² | |
RefReference Winter |
9.6 ft/s² | -2.1 ft/s² |
| 9.3 ft/s² | -2.4 ft/s² | |
| 8.7 ft/s² | -3.0 ft/s² | |
| 8.0 ft/s² | -3.7 ft/s² |
The difference between best and worst was 31.8% (3.7 ft/s²).
Snow
The Goodyear was back at the front for snow braking, with the BFGoodrich also beating the Michelin, which is traditionally the strongest all season tire in the snow.
Snow Braking
Snow braking in feet (31 - 0 mph)
Lower is better ↓| Position / Tire | Result | Gap to best | Residual speed |
|---|---|---|---|
RefReference Winter |
69 ft | -5 ft | 0 mph |
| 74 ft | Best | 0 mph | |
| 75 ft | +1 ft | 11 mph | |
| 75 ft | +1 ft | 12 mph | |
| 76 ft | +2 ft | 13 mph | |
| 76 ft | +2 ft | 13 mph | |
| 76 ft | +2 ft | 13 mph | |
| 76 ft | +2 ft | 14 mph | |
| 76 ft | +2 ft | 14 mph | |
| 77 ft | +3 ft | 16 mph | |
| 77 ft | +3 ft | 16 mph | |
| 77 ft | +3 ft | 17 mph | |
| 78 ft | +4 ft | 19 mph | |
| 78 ft | +4 ft | 19 mph | |
| 80 ft | +6 ft | 23 mph | |
| 81 ft | +7 ft | 24 mph | |
| 84 ft | +10 ft | 28 mph | |
RefReference Summer |
211 ft | +137 ft | 65 mph |
The difference between best and worst was 207.7% (142 ft ≈ 9.6 Car Lengths). From 80 mph, the Falken Euroall Season AS220 Pro would still be travelling at 28 mph when the Goodyear Vector 4Seasons Gen 3 had stopped.
Residual speed is calculated from the measured braking distances, assuming constant deceleration; it is not a separate measurement.
Goodyear also beat the Michelin in snow traction testing.
Snow Traction
Pulling Force in pounds-force
Higher is better ↑| Position / Tire | Result | Gap to best |
|---|---|---|
RefReference Winter |
650 lbf | +26 lbf |
| 624 lbf | Best | |
| 622 lbf | -2 lbf | |
| 617 lbf | -7 lbf | |
| 610 lbf | -14 lbf | |
| 604 lbf | -20 lbf | |
| 603 lbf | -21 lbf | |
| 601 lbf | -23 lbf | |
| 598 lbf | -26 lbf | |
| 593 lbf | -31 lbf | |
| 587 lbf | -37 lbf | |
| 585 lbf | -39 lbf | |
| 582 lbf | -42 lbf | |
| 571 lbf | -53 lbf | |
| 564 lbf | -60 lbf | |
| 557 lbf | -67 lbf | |
| 542 lbf | -82 lbf | |
RefReference Summer |
185 lbf | -439 lbf |
The difference between best and worst was 71.6% (465 lbf).
The CrossClimate 2 was back at the front for snow handling, closely followed by the new Bridgestone.
Snow Handling
Snow handling average speed
Higher is better ↑| Position / Tire | Result | Gap to best |
|---|---|---|
RefReference Winter |
36.5 mph | +0.4 mph |
| 36.1 mph | Best | |
| 35.8 mph | -0.3 mph | |
| 35.8 mph | -0.3 mph | |
| 35.7 mph | -0.4 mph | |
| 35.7 mph | -0.4 mph | |
| 35.7 mph | -0.4 mph | |
| 35.7 mph | -0.4 mph | |
| 35.6 mph | -0.5 mph | |
| 35.5 mph | -0.6 mph | |
| 35.4 mph | -0.7 mph | |
| 35.0 mph | -1.1 mph | |
| 34.9 mph | -1.2 mph | |
| 34.7 mph | -1.4 mph | |
| 34.5 mph | -1.6 mph | |
| 34.4 mph | -1.7 mph | |
| 34.1 mph | -2.0 mph | |
RefReference Summer |
0.6 mph | -35.5 mph |
The difference between best and worst was 98.3% (35.9 mph).

Comfort
The Kumho had the lowest external noise, with the Pirelli and Continental also proving to be quiet tires.
Noise
External noise in dB
Lower is better ↓| Position / Tire | Result | Gap to best |
|---|---|---|
| 72 dB | Best | |
| 72.2 dB | +0.20 dB | |
| 72.3 dB | +0.30 dB | |
RefReference Winter |
72.5 dB | +0.50 dB |
| 72.6 dB | +0.60 dB | |
| 72.7 dB | +0.70 dB | |
| 72.7 dB | +0.70 dB | |
| 72.8 dB | +0.80 dB | |
| 72.8 dB | +0.80 dB | |
| 72.9 dB | +0.90 dB | |
| 73 dB | +1.00 dB | |
| 73.1 dB | +1.10 dB | |
| 73.1 dB | +1.10 dB | |
RefReference Summer |
73.2 dB | +1.20 dB |
| 73.3 dB | +1.30 dB | |
| 73.3 dB | +1.30 dB | |
| 73.3 dB | +1.30 dB | |
| 74.2 dB | +2.20 dB |
The difference between best and worst was 3.1% (2.2 dB).
Value
The important wear tests highlighted some interesting results! The Nexen N Blue 4Season 2 had a huge lead over the group, with a predicted 75,034 kms, with Hankook and the new Continental also performing extremely well. The new Bridgestone has improve the wear of the previous product, but could still only end up midpack in the group. Firestone and Falken performed well below average.
Wear
Predicted tread life in KM
Higher is better ↑| Position / Tire | Result | Gap to best |
|---|---|---|
| 46,624 miles | Best | |
| 37,462 miles | -9,162 miles | |
| 36,613 miles | -10,011 miles | |
| 35,498 miles | -11,126 miles | |
| 35,447 miles | -11,177 miles | |
| 34,804 miles | -11,820 miles | |
| 32,282 miles | -14,342 miles | |
| 30,941 miles | -15,683 miles | |
| 30,453 miles | -16,171 miles | |
| 27,346 miles | -19,278 miles | |
| 26,776 miles | -19,848 miles | |
| 26,375 miles | -20,249 miles | |
| 25,052 miles | -21,572 miles | |
| 24,537 miles | -22,087 miles | |
| 21,325 miles | -25,299 miles | |
| 18,680 miles | -27,944 miles |
The difference between best and worst was 59.9% (27,944 miles).
Nexen kept its lead in the value metric, which is the expected mileage divided by the purchase price, proving to cost a third of the worst tires in the group. Of the top tires, the Hankook, Goodyear and Continental all proved to be good value.
Value
Euros/1000km based on cost/wear
Lower is better ↓| Position / Tire | Result | Gap to best | cost per 1,000 miles |
|---|---|---|---|
| 4.6 Price/1000 | Best | €13.94 | |
| 6.16 Price/1000 | +1.56 Price/1000 | €21.40 | |
| 6.47 Price/1000 | +1.87 Price/1000 | €18.69 | |
| 7.05 Price/1000 | +2.45 Price/1000 | €18.94 | |
| 7.35 Price/1000 | +2.75 Price/1000 | €22.13 | |
| 7.61 Price/1000 | +3.01 Price/1000 | €20.46 | |
| 8.15 Price/1000 | +3.55 Price/1000 | €18.11 | |
| 8.71 Price/1000 | +4.11 Price/1000 | €19.78 | |
| 8.76 Price/1000 | +4.16 Price/1000 | €19.23 | |
| 9.75 Price/1000 | +5.15 Price/1000 | €24.89 | |
| 10.13 Price/1000 | +5.53 Price/1000 | €22.24 | |
| 10.13 Price/1000 | +5.53 Price/1000 | €27.44 | |
| 10.74 Price/1000 | +6.14 Price/1000 | €23.71 | |
| 12.28 Price/1000 | +7.68 Price/1000 | €25.76 | |
| 12.53 Price/1000 | +7.93 Price/1000 | €34.42 | |
| 12.64 Price/1000 | +8.04 Price/1000 | €24.09 |
The difference between best and worst was 174.8% (8.04 Price/1000). Over 25,000 miles the cheapest tire to own (Nexen N Blue 4Season 2) works out €512 cheaper than the most expensive (Falken Euroall Season AS220 Pro).
How this is calculated
Assumes a typical car doing 29 mpg (rolling resistance causing 20% of fuel use), fuel at €6.25 per gallon and €70 fitting per set of four. Purchase prices are from the time of the 2023 test; financing costs are excluded.
Firestone might have worn quickly, but it had the lowest rolling resistance by an impressive amount! The new Continental also performed very well in second.
Rolling Resistance
Rolling resistance in kg t
Lower is better ↓| Position / Tire | Result | Gap to best | Extra fuel / year |
|---|---|---|---|
| 7.16 kg/t | Best | $0 | |
| 7.68 kg/t | +0.52 kg/t | $21 | |
| 7.68 kg/t | +0.52 kg/t | $21 | |
| 7.69 kg/t | +0.53 kg/t | $22 | |
| 7.69 kg/t | +0.53 kg/t | $22 | |
| 7.7 kg/t | +0.54 kg/t | $22 | |
| 7.86 kg/t | +0.70 kg/t | $29 | |
RefReference Summer |
7.88 kg/t | +0.72 kg/t | $30 |
| 8.01 kg/t | +0.85 kg/t | $35 | |
| 8.1 kg/t | +0.94 kg/t | $39 | |
| 8.21 kg/t | +1.05 kg/t | $43 | |
| 8.24 kg/t | +1.08 kg/t | $44 | |
| 8.27 kg/t | +1.11 kg/t | $46 | |
| 8.51 kg/t | +1.35 kg/t | $55 | |
RefReference Winter |
8.52 kg/t | +1.36 kg/t | $56 |
| 8.59 kg/t | +1.43 kg/t | $59 | |
| 8.73 kg/t | +1.57 kg/t | $64 | |
| 9.01 kg/t | +1.85 kg/t | $76 |
The difference between best and worst was 25.8% (1.85 kg / t). Over 12,000 miles a year at $3.60/gal, the Falken Euroall Season AS220 Pro uses about 21 gal ($76) more fuel than the Firestone MultiSeason Gen 02.
Adjust the assumptions
Calculated estimates, not additional measurements. Use the controls to explore the assumptions.
Auto Bild have started testing the fuel consumption, which changes the order somewhat. Whether this is down to test conditions, or there's more to rolling resistance than the drum test shows we're not sure.
Fuel Consumption
Fuel consumption in Liters per 100 km
Lower is better ↓| Position / Tire | Result | Gap to best | Extra fuel / year |
|---|---|---|---|
| 5.35 l/100km | Best | $0 | |
| 5.46 l/100km | +0.11 l/100km | $20 | |
| 5.47 l/100km | +0.12 l/100km | $22 | |
| 5.48 l/100km | +0.13 l/100km | $24 | |
| 5.49 l/100km | +0.14 l/100km | $26 | |
| 5.56 l/100km | +0.21 l/100km | $39 | |
| 5.57 l/100km | +0.22 l/100km | $40 | |
| 5.58 l/100km | +0.23 l/100km | $42 | |
| 5.64 l/100km | +0.29 l/100km | $53 | |
| 5.65 l/100km | +0.30 l/100km | $55 | |
| 5.66 l/100km | +0.31 l/100km | $57 | |
| 5.67 l/100km | +0.32 l/100km | $59 | |
| 5.68 l/100km | +0.33 l/100km | $61 | |
| 5.68 l/100km | +0.33 l/100km | $61 | |
| 5.74 l/100km | +0.39 l/100km | $72 | |
| 5.78 l/100km | +0.43 l/100km | $79 |
The difference between best and worst was 8% (0.43 l/100km). Over 12,000 miles a year at $3.60/gal, the Vredestein Quatrac uses about 22 gal ($79) more fuel than the Dunlop Sport All Season.
Adjust the assumptions
Calculated estimates, not additional measurements. Use the controls to explore the assumptions.
Results
Michelin CrossClimate 2
225/45 R17 94Y XL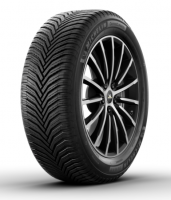
Category scores (% of best)
All discipline results (17)
Discipline positions compare the ranked tires in this test, not the whole market. These are individual measurements, not weighted overall scores.
| Test | Position in discipline | Result | Gap to best |
|---|---|---|---|
| Dry BrakingLower is better | 1st / 16 | 124 ft | Best in this discipline |
| Dry HandlingHigher is better | 2nd / 16 | 55.4 mph | -0.4 mph |
| Wet BrakingLower is better | 6th / 16 | 154 ft | +6 ft |
| Wet HandlingHigher is better | 10th / 16 | 45.2 mph | -2.1 mph |
| Wet CircleLower is better | 10th / 16 | 11.99 s | +0.37 s |
| Straight AquaHigher is better | 6th / 16 | 49.1 mph | -1.7 mph |
| Curved AquaplaningHigher is better | 7th / 16 | 10.8 ft/s² | -0.9 ft/s² |
| Snow BrakingLower is better | 3rd / 16 | 75 ft | +1 ft |
| Snow TractionHigher is better | 2nd / 16 | 622 lbf | -2 lbf |
| Snow HandlingHigher is better | 1st / 16 | 36.1 mph | Best in this discipline |
| Snow SlalomHigher is better | 1st / 16 | 14.0 ft/s² | Best in this discipline |
| NoiseLower is better | 4th / 16 | 72.6 dB | +0.60 dB |
| Tire WeightLower is better | 3rd / 16 | 77.2 lb | +2.2 lb |
| WearHigher is better | 5th / 16 | 35,447 miles | -11,177 miles |
| ValueLower is better | 9th / 16 | 8.76 Price/1000 | +4.16 Price/1000 |
| Rolling ResistanceLower is better | 4th / 16 | 7.69 kg/t | +0.53 kg/t |
| Fuel ConsumptionLower is better | 4th / 16 | 5.48 l/100km | +0.13 l/100km |
- EU Label
- C/B/71
- 3PMSF
- Yes
- Price
- 500.00
Continental AllSeasonContact 2
225/45 R17 94V XL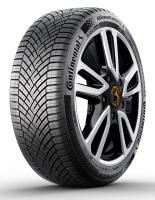
Category scores (% of best)
All discipline results (17)
Discipline positions compare the ranked tires in this test, not the whole market. These are individual measurements, not weighted overall scores.
| Test | Position in discipline | Result | Gap to best |
|---|---|---|---|
| Dry BrakingLower is better | 9th / 16 | 133 ft | +9 ft |
| Dry HandlingHigher is better | 13th / 16 | 54.6 mph | -1.2 mph |
| Wet BrakingLower is better | 2nd / 16 | 149 ft | +1 ft |
| Wet HandlingHigher is better | 5th / 16 | 46.4 mph | -0.9 mph |
| Wet CircleLower is better | 9th / 16 | 11.96 s | +0.34 s |
| Straight AquaHigher is better | 10th / 16 | 47.3 mph | -3.5 mph |
| Curved AquaplaningHigher is better | 13th / 16 | 9.7 ft/s² | -2.0 ft/s² |
| Snow BrakingLower is better | 7th / 16 | 76 ft | +2 ft |
| Snow TractionHigher is better | 3rd / 16 | 617 lbf | -7 lbf |
| Snow HandlingHigher is better | 6th / 16 | 35.7 mph | -0.4 mph |
| Snow SlalomHigher is better | 2nd / 16 | 13.9 ft/s² | -0.1 ft/s² |
| NoiseLower is better | 3rd / 16 | 72.3 dB | +0.30 dB |
| Tire WeightLower is better | 12th / 16 | 82.0 lb | +7.0 lb |
| WearHigher is better | 3rd / 16 | 36,613 miles | -10,011 miles |
| ValueLower is better | 7th / 16 | 8.15 Price/1000 | +3.55 Price/1000 |
| Rolling ResistanceLower is better | 2nd / 16 | 7.68 kg/t | +0.52 kg/t |
| Fuel ConsumptionLower is better | 6th / 16 | 5.56 l/100km | +0.21 l/100km |
- EU Label
- C/B/72
- 3PMSF
- Yes
- Price
- 480.00
Bridgestone Turanza All Season 6
225/45 R17 94W XL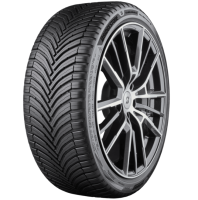
Category scores (% of best)
All discipline results (17)
Discipline positions compare the ranked tires in this test, not the whole market. These are individual measurements, not weighted overall scores.
| Test | Position in discipline | Result | Gap to best |
|---|---|---|---|
| Dry BrakingLower is better | 3rd / 16 | 126 ft | +2 ft |
| Dry HandlingHigher is better | 5th / 16 | 55.2 mph | -0.6 mph |
| Wet BrakingLower is better | 1st / 16 | 148 ft | Best in this discipline |
| Wet HandlingHigher is better | 3rd / 16 | 46.4 mph | -0.9 mph |
| Wet CircleLower is better | 5th / 16 | 11.86 s | +0.24 s |
| Straight AquaHigher is better | 4th / 16 | 49.6 mph | -1.2 mph |
| Curved AquaplaningHigher is better | 10th / 16 | 10.3 ft/s² | -1.4 ft/s² |
| Snow BrakingLower is better | 4th / 16 | 76 ft | +2 ft |
| Snow TractionHigher is better | 8th / 16 | 598 lbf | -26 lbf |
| Snow HandlingHigher is better | 2nd / 16 | 35.8 mph | -0.3 mph |
| Snow SlalomHigher is better | 4th / 16 | 13.6 ft/s² | -0.4 ft/s² |
| NoiseLower is better | 13th / 16 | 73.3 dB | +1.30 dB |
| Tire WeightLower is better | 12th / 16 | 82.0 lb | +7.0 lb |
| WearHigher is better | 8th / 16 | 30,941 miles | -15,683 miles |
| ValueLower is better | 13th / 16 | 10.74 Price/1000 | +6.14 Price/1000 |
| Rolling ResistanceLower is better | 7th / 16 | 7.86 kg/t | +0.70 kg/t |
| Fuel ConsumptionLower is better | 2nd / 16 | 5.46 l/100km | +0.11 l/100km |
- EU Label
- C/B/70
- 3PMSF
- Yes
- Price
- 535.00
Vredestein Quatrac
225/45 R17 94V XL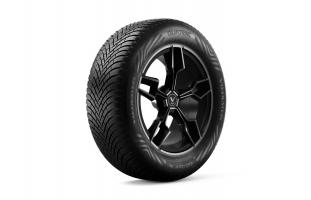
Category scores (% of best)
All discipline results (17)
Discipline positions compare the ranked tires in this test, not the whole market. These are individual measurements, not weighted overall scores.
| Test | Position in discipline | Result | Gap to best |
|---|---|---|---|
| Dry BrakingLower is better | 8th / 16 | 132 ft | +8 ft |
| Dry HandlingHigher is better | 4th / 16 | 55.3 mph | -0.5 mph |
| Wet BrakingLower is better | 2nd / 16 | 149 ft | +1 ft |
| Wet HandlingHigher is better | 1st / 16 | 47.3 mph | Best in this discipline |
| Wet CircleLower is better | 1st / 16 | 11.62 s | Best in this discipline |
| Straight AquaHigher is better | 5th / 16 | 49.2 mph | -1.6 mph |
| Curved AquaplaningHigher is better | 8th / 16 | 10.7 ft/s² | -1.0 ft/s² |
| Snow BrakingLower is better | 4th / 16 | 76 ft | +2 ft |
| Snow TractionHigher is better | 11th / 16 | 585 lbf | -39 lbf |
| Snow HandlingHigher is better | 9th / 16 | 35.5 mph | -0.6 mph |
| Snow SlalomHigher is better | 9th / 16 | 12.9 ft/s² | -1.1 ft/s² |
| NoiseLower is better | 9th / 16 | 72.9 dB | +0.90 dB |
| Tire WeightLower is better | 11th / 16 | 80.5 lb | +5.5 lb |
| WearHigher is better | 11th / 16 | 26,776 miles | -19,848 miles |
| ValueLower is better | 10th / 16 | 9.75 Price/1000 | +5.15 Price/1000 |
| Rolling ResistanceLower is better | 12th / 16 | 8.27 kg/t | +1.11 kg/t |
| Fuel ConsumptionLower is better | 16th / 16 | 5.78 l/100km | +0.43 l/100km |
- EU Label
- C/B/71
- 3PMSF
- Yes
- Price
- 420.00
Pirelli Cinturato All Season SF2
225/45 R17 94W XL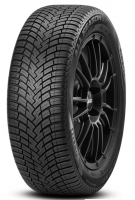
Category scores (% of best)
All discipline results (17)
Discipline positions compare the ranked tires in this test, not the whole market. These are individual measurements, not weighted overall scores.
| Test | Position in discipline | Result | Gap to best |
|---|---|---|---|
| Dry BrakingLower is better | 4th / 16 | 127 ft | +3 ft |
| Dry HandlingHigher is better | 7th / 16 | 55.1 mph | -0.7 mph |
| Wet BrakingLower is better | 5th / 16 | 153 ft | +5 ft |
| Wet HandlingHigher is better | 6th / 16 | 46.3 mph | -1.0 mph |
| Wet CircleLower is better | 8th / 16 | 11.95 s | +0.33 s |
| Straight AquaHigher is better | 1st / 16 | 50.8 mph | Best in this discipline |
| Curved AquaplaningHigher is better | 9th / 16 | 10.4 ft/s² | -1.3 ft/s² |
| Snow BrakingLower is better | 11th / 16 | 77 ft | +3 ft |
| Snow TractionHigher is better | 10th / 16 | 587 lbf | -37 lbf |
| Snow HandlingHigher is better | 4th / 16 | 35.7 mph | -0.4 mph |
| Snow SlalomHigher is better | 7th / 16 | 13.3 ft/s² | -0.7 ft/s² |
| NoiseLower is better | 2nd / 16 | 72.2 dB | +0.20 dB |
| Tire WeightLower is better | 6th / 16 | 79.8 lb | +4.8 lb |
| WearHigher is better | 12th / 16 | 26,375 miles | -20,249 miles |
| ValueLower is better | 11th / 16 | 10.13 Price/1000 | +5.53 Price/1000 |
| Rolling ResistanceLower is better | 14th / 16 | 8.59 kg/t | +1.43 kg/t |
| Fuel ConsumptionLower is better | 13th / 16 | 5.68 l/100km | +0.33 l/100km |
- EU Label
- C/A/70
- 3PMSF
- Yes
- Price
- 430.00
Goodyear Vector 4Seasons Gen 3
225/45 R17 94W XL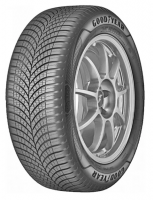
Category scores (% of best)
All discipline results (17)
Discipline positions compare the ranked tires in this test, not the whole market. These are individual measurements, not weighted overall scores.
| Test | Position in discipline | Result | Gap to best |
|---|---|---|---|
| Dry BrakingLower is better | 14th / 16 | 137 ft | +13 ft |
| Dry HandlingHigher is better | 1st / 16 | 55.8 mph | Best in this discipline |
| Wet BrakingLower is better | 10th / 16 | 158 ft | +10 ft |
| Wet HandlingHigher is better | 2nd / 16 | 46.5 mph | -0.8 mph |
| Wet CircleLower is better | 3rd / 16 | 11.74 s | +0.12 s |
| Straight AquaHigher is better | 9th / 16 | 47.9 mph | -2.9 mph |
| Curved AquaplaningHigher is better | 2nd / 16 | 11.1 ft/s² | -0.6 ft/s² |
| Snow BrakingLower is better | 1st / 16 | 74 ft | Best in this discipline |
| Snow TractionHigher is better | 1st / 16 | 624 lbf | Best in this discipline |
| Snow HandlingHigher is better | 6th / 16 | 35.7 mph | -0.4 mph |
| Snow SlalomHigher is better | 5th / 16 | 13.4 ft/s² | -0.6 ft/s² |
| NoiseLower is better | 13th / 16 | 73.3 dB | +1.30 dB |
| Tire WeightLower is better | 2nd / 16 | 76.9 lb | +1.9 lb |
| WearHigher is better | 4th / 16 | 35,498 miles | -11,126 miles |
| ValueLower is better | 6th / 16 | 7.61 Price/1000 | +3.01 Price/1000 |
| Rolling ResistanceLower is better | 10th / 16 | 8.21 kg/t | +1.05 kg/t |
| Fuel ConsumptionLower is better | 11th / 16 | 5.66 l/100km | +0.31 l/100km |
- EU Label
- C/B/70
- 3PMSF
- Yes
- Price
- 435.00
Kleber Quadraxer 3
225/45 R17 94V XL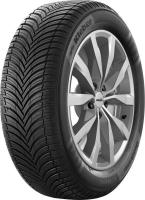
Category scores (% of best)
All discipline results (17)
Discipline positions compare the ranked tires in this test, not the whole market. These are individual measurements, not weighted overall scores.
| Test | Position in discipline | Result | Gap to best |
|---|---|---|---|
| Dry BrakingLower is better | 2nd / 16 | 126 ft | +2 ft |
| Dry HandlingHigher is better | 2nd / 16 | 55.4 mph | -0.4 mph |
| Wet BrakingLower is better | 11th / 16 | 159 ft | +11 ft |
| Wet HandlingHigher is better | 13th / 16 | 44.1 mph | -3.2 mph |
| Wet CircleLower is better | 13th / 16 | 12.07 s | +0.45 s |
| Straight AquaHigher is better | 2nd / 16 | 50.0 mph | -0.8 mph |
| Curved AquaplaningHigher is better | 3rd / 16 | 11.0 ft/s² | -0.7 ft/s² |
| Snow BrakingLower is better | 7th / 16 | 76 ft | +2 ft |
| Snow TractionHigher is better | 6th / 16 | 603 lbf | -21 lbf |
| Snow HandlingHigher is better | 2nd / 16 | 35.8 mph | -0.3 mph |
| Snow SlalomHigher is better | 5th / 16 | 13.4 ft/s² | -0.6 ft/s² |
| NoiseLower is better | 7th / 16 | 72.8 dB | +0.80 dB |
| Tire WeightLower is better | 4th / 16 | 77.8 lb | +2.8 lb |
| WearHigher is better | 10th / 16 | 27,346 miles | -19,278 miles |
| ValueLower is better | 8th / 16 | 8.71 Price/1000 | +4.11 Price/1000 |
| Rolling ResistanceLower is better | 4th / 16 | 7.69 kg/t | +0.53 kg/t |
| Fuel ConsumptionLower is better | 3rd / 16 | 5.47 l/100km | +0.12 l/100km |
- EU Label
- C/B/69
- 3PMSF
- Yes
- Price
- 385.00
Hankook Kinergy 4S2
225/45 R17 94W XL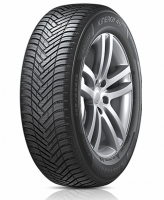
Category scores (% of best)
All discipline results (17)
Discipline positions compare the ranked tires in this test, not the whole market. These are individual measurements, not weighted overall scores.
| Test | Position in discipline | Result | Gap to best |
|---|---|---|---|
| Dry BrakingLower is better | 12th / 16 | 135 ft | +11 ft |
| Dry HandlingHigher is better | 13th / 16 | 54.6 mph | -1.2 mph |
| Wet BrakingLower is better | 13th / 16 | 162 ft | +14 ft |
| Wet HandlingHigher is better | 11th / 16 | 44.8 mph | -2.5 mph |
| Wet CircleLower is better | 7th / 16 | 11.94 s | +0.32 s |
| Straight AquaHigher is better | 7th / 16 | 48.8 mph | -2.0 mph |
| Curved AquaplaningHigher is better | 1st / 16 | 11.7 ft/s² | Best in this discipline |
| Snow BrakingLower is better | 4th / 16 | 76 ft | +2 ft |
| Snow TractionHigher is better | 9th / 16 | 593 lbf | -31 lbf |
| Snow HandlingHigher is better | 8th / 16 | 35.6 mph | -0.5 mph |
| Snow SlalomHigher is better | 8th / 16 | 13.2 ft/s² | -0.8 ft/s² |
| NoiseLower is better | 11th / 16 | 73.1 dB | +1.10 dB |
| Tire WeightLower is better | 8th / 16 | 80.2 lb | +5.2 lb |
| WearHigher is better | 2nd / 16 | 37,462 miles | -9,162 miles |
| ValueLower is better | 3rd / 16 | 6.47 Price/1000 | +1.87 Price/1000 |
| Rolling ResistanceLower is better | 11th / 16 | 8.24 kg/t | +1.08 kg/t |
| Fuel ConsumptionLower is better | 15th / 16 | 5.74 l/100km | +0.39 l/100km |
- EU Label
- C/B/72
- 3PMSF
- Yes
- Price
- 390.00
BFGoodrich Advantage All Season
225/45 R17 94W XL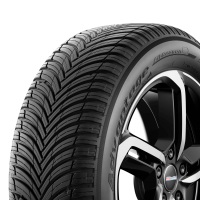
Category scores (% of best)
All discipline results (17)
Discipline positions compare the ranked tires in this test, not the whole market. These are individual measurements, not weighted overall scores.
| Test | Position in discipline | Result | Gap to best |
|---|---|---|---|
| Dry BrakingLower is better | 5th / 16 | 128 ft | +4 ft |
| Dry HandlingHigher is better | 10th / 16 | 54.8 mph | -1.0 mph |
| Wet BrakingLower is better | 7th / 16 | 156 ft | +8 ft |
| Wet HandlingHigher is better | 12th / 16 | 44.7 mph | -2.6 mph |
| Wet CircleLower is better | 15th / 16 | 12.21 s | +0.59 s |
| Straight AquaHigher is better | 2nd / 16 | 50.0 mph | -0.8 mph |
| Curved AquaplaningHigher is better | 5th / 16 | 10.9 ft/s² | -0.8 ft/s² |
| Snow BrakingLower is better | 2nd / 16 | 75 ft | +1 ft |
| Snow TractionHigher is better | 4th / 16 | 610 lbf | -14 lbf |
| Snow HandlingHigher is better | 4th / 16 | 35.7 mph | -0.4 mph |
| Snow SlalomHigher is better | 3rd / 16 | 13.7 ft/s² | -0.3 ft/s² |
| NoiseLower is better | 10th / 16 | 73 dB | +1.00 dB |
| Tire WeightLower is better | 4th / 16 | 77.8 lb | +2.8 lb |
| WearHigher is better | 13th / 16 | 25,052 miles | -21,572 miles |
| ValueLower is better | 14th / 16 | 12.28 Price/1000 | +7.68 Price/1000 |
| Rolling ResistanceLower is better | 6th / 16 | 7.7 kg/t | +0.54 kg/t |
| Fuel ConsumptionLower is better | 7th / 16 | 5.57 l/100km | +0.22 l/100km |
- EU Label
- C/B/69
- 3PMSF
- Yes
- Price
- 495.00
Kumho Solus 4S HA32+
225/45 R17 94W XL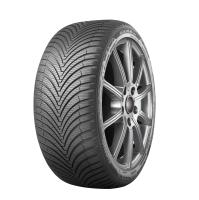
Category scores (% of best)
All discipline results (17)
Discipline positions compare the ranked tires in this test, not the whole market. These are individual measurements, not weighted overall scores.
| Test | Position in discipline | Result | Gap to best |
|---|---|---|---|
| Dry BrakingLower is better | 13th / 16 | 136 ft | +12 ft |
| Dry HandlingHigher is better | 8th / 16 | 55.0 mph | -0.8 mph |
| Wet BrakingLower is better | 14th / 16 | 163 ft | +15 ft |
| Wet HandlingHigher is better | 3rd / 16 | 46.4 mph | -0.9 mph |
| Wet CircleLower is better | 4th / 16 | 11.83 s | +0.21 s |
| Straight AquaHigher is better | 13th / 16 | 45.2 mph | -5.6 mph |
| Curved AquaplaningHigher is better | 16th / 16 | 8.0 ft/s² | -3.7 ft/s² |
| Snow BrakingLower is better | 9th / 16 | 77 ft | +3 ft |
| Snow TractionHigher is better | 7th / 16 | 601 lbf | -23 lbf |
| Snow HandlingHigher is better | 11th / 16 | 35.0 mph | -1.1 mph |
| Snow SlalomHigher is better | 12th / 16 | 12.5 ft/s² | -1.5 ft/s² |
| NoiseLower is better | 1st / 16 | 72 dB | Best in this discipline |
| Tire WeightLower is better | 15th / 16 | 83.8 lb | +8.8 lb |
| WearHigher is better | 9th / 16 | 30,453 miles | -16,171 miles |
| ValueLower is better | 5th / 16 | 7.35 Price/1000 | +2.75 Price/1000 |
| Rolling ResistanceLower is better | 13th / 16 | 8.51 kg/t | +1.35 kg/t |
| Fuel ConsumptionLower is better | 12th / 16 | 5.67 l/100km | +0.32 l/100km |
- EU Label
- C/B/72
- 3PMSF
- Yes
- Price
- 360.00
Dunlop Sport All Season
225/45 R17 94W XL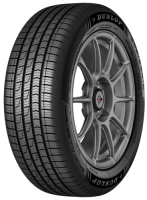
Category scores (% of best)
All discipline results (17)
Discipline positions compare the ranked tires in this test, not the whole market. These are individual measurements, not weighted overall scores.
| Test | Position in discipline | Result | Gap to best |
|---|---|---|---|
| Dry BrakingLower is better | 16th / 16 | 139 ft | +15 ft |
| Dry HandlingHigher is better | 11th / 16 | 54.7 mph | -1.1 mph |
| Wet BrakingLower is better | 7th / 16 | 156 ft | +8 ft |
| Wet HandlingHigher is better | 6th / 16 | 46.3 mph | -1.0 mph |
| Wet CircleLower is better | 2nd / 16 | 11.69 s | +0.07 s |
| Straight AquaHigher is better | 15th / 16 | 44.9 mph | -5.9 mph |
| Curved AquaplaningHigher is better | 3rd / 16 | 11.0 ft/s² | -0.7 ft/s² |
| Snow BrakingLower is better | 12th / 16 | 78 ft | +4 ft |
| Snow TractionHigher is better | 12th / 16 | 582 lbf | -42 lbf |
| Snow HandlingHigher is better | 12th / 16 | 34.9 mph | -1.2 mph |
| Snow SlalomHigher is better | 14th / 16 | 12.0 ft/s² | -2.0 ft/s² |
| NoiseLower is better | 16th / 16 | 74.2 dB | +2.20 dB |
| Tire WeightLower is better | 1st / 16 | 75.0 lb | Best in this discipline |
| WearHigher is better | 14th / 16 | 24,537 miles | -22,087 miles |
| ValueLower is better | 11th / 16 | 10.13 Price/1000 | +5.53 Price/1000 |
| Rolling ResistanceLower is better | 2nd / 16 | 7.68 kg/t | +0.52 kg/t |
| Fuel ConsumptionLower is better | 1st / 16 | 5.35 l/100km | Best in this discipline |
- EU Label
- C/B/71
- 3PMSF
- Yes
- Price
- 400.00
Nexen N Blue 4Season 2
225/45 R17 94W XL
Category scores (% of best)
All discipline results (17)
Discipline positions compare the ranked tires in this test, not the whole market. These are individual measurements, not weighted overall scores.
| Test | Position in discipline | Result | Gap to best |
|---|---|---|---|
| Dry BrakingLower is better | 6th / 16 | 129 ft | +5 ft |
| Dry HandlingHigher is better | 8th / 16 | 55.0 mph | -0.8 mph |
| Wet BrakingLower is better | 12th / 16 | 160 ft | +12 ft |
| Wet HandlingHigher is better | 16th / 16 | 43.8 mph | -3.5 mph |
| Wet CircleLower is better | 13th / 16 | 12.07 s | +0.45 s |
| Straight AquaHigher is better | 13th / 16 | 45.2 mph | -5.6 mph |
| Curved AquaplaningHigher is better | 12th / 16 | 10.0 ft/s² | -1.7 ft/s² |
| Snow BrakingLower is better | 15th / 16 | 81 ft | +7 ft |
| Snow TractionHigher is better | 13th / 16 | 571 lbf | -53 lbf |
| Snow HandlingHigher is better | 15th / 16 | 34.4 mph | -1.7 mph |
| Snow SlalomHigher is better | 11th / 16 | 12.5 ft/s² | -1.5 ft/s² |
| NoiseLower is better | 5th / 16 | 72.7 dB | +0.70 dB |
| Tire WeightLower is better | 8th / 16 | 80.2 lb | +5.2 lb |
| WearHigher is better | 1st / 16 | 46,624 miles | Best in this discipline |
| ValueLower is better | 1st / 16 | 4.6 Price/1000 | Best in this discipline |
| Rolling ResistanceLower is better | 8th / 16 | 8.01 kg/t | +0.85 kg/t |
| Fuel ConsumptionLower is better | 13th / 16 | 5.68 l/100km | +0.33 l/100km |
- EU Label
- D/A/72
- 3PMSF
- Yes
- Price
- 345.00
Firestone MultiSeason Gen 02
225/45 R17 94V XL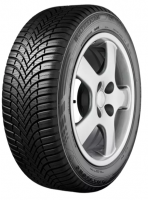
Category scores (% of best)
All discipline results (17)
Discipline positions compare the ranked tires in this test, not the whole market. These are individual measurements, not weighted overall scores.
| Test | Position in discipline | Result | Gap to best |
|---|---|---|---|
| Dry BrakingLower is better | 14th / 16 | 137 ft | +13 ft |
| Dry HandlingHigher is better | 16th / 16 | 54.4 mph | -1.4 mph |
| Wet BrakingLower is better | 9th / 16 | 157 ft | +9 ft |
| Wet HandlingHigher is better | 8th / 16 | 45.7 mph | -1.6 mph |
| Wet CircleLower is better | 12th / 16 | 12.06 s | +0.44 s |
| Straight AquaHigher is better | 16th / 16 | 44.4 mph | -6.4 mph |
| Curved AquaplaningHigher is better | 15th / 16 | 8.7 ft/s² | -3.0 ft/s² |
| Snow BrakingLower is better | 9th / 16 | 77 ft | +3 ft |
| Snow TractionHigher is better | 5th / 16 | 604 lbf | -20 lbf |
| Snow HandlingHigher is better | 10th / 16 | 35.4 mph | -0.7 mph |
| Snow SlalomHigher is better | 13th / 16 | 12.4 ft/s² | -1.6 ft/s² |
| NoiseLower is better | 5th / 16 | 72.7 dB | +0.70 dB |
| Tire WeightLower is better | 8th / 16 | 80.2 lb | +5.2 lb |
| WearHigher is better | 16th / 16 | 18,680 miles | -27,944 miles |
| ValueLower is better | 16th / 16 | 12.64 Price/1000 | +8.04 Price/1000 |
| Rolling ResistanceLower is better | 1st / 16 | 7.16 kg/t | Best in this discipline |
| Fuel ConsumptionLower is better | 5th / 16 | 5.49 l/100km | +0.14 l/100km |
- EU Label
- C/B/72
- 3PMSF
- Yes
- Price
- 380.00
Toyo Celsius AS2
225/45 R17 94W XL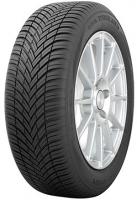
Category scores (% of best)
All discipline results (17)
Discipline positions compare the ranked tires in this test, not the whole market. These are individual measurements, not weighted overall scores.
| Test | Position in discipline | Result | Gap to best |
|---|---|---|---|
| Dry BrakingLower is better | 11th / 16 | 134 ft | +10 ft |
| Dry HandlingHigher is better | 12th / 16 | 54.6 mph | -1.2 mph |
| Wet BrakingLower is better | 16th / 16 | 166 ft | +18 ft |
| Wet HandlingHigher is better | 14th / 16 | 44.0 mph | -3.3 mph |
| Wet CircleLower is better | 16th / 16 | 12.26 s | +0.64 s |
| Straight AquaHigher is better | 7th / 16 | 48.8 mph | -2.0 mph |
| Curved AquaplaningHigher is better | 5th / 16 | 10.9 ft/s² | -0.8 ft/s² |
| Snow BrakingLower is better | 12th / 16 | 78 ft | +4 ft |
| Snow TractionHigher is better | 16th / 16 | 542 lbf | -82 lbf |
| Snow HandlingHigher is better | 14th / 16 | 34.5 mph | -1.6 mph |
| Snow SlalomHigher is better | 10th / 16 | 12.8 ft/s² | -1.2 ft/s² |
| NoiseLower is better | 13th / 16 | 73.3 dB | +1.30 dB |
| Tire WeightLower is better | 14th / 16 | 82.7 lb | +7.7 lb |
| WearHigher is better | 6th / 16 | 34,804 miles | -11,820 miles |
| ValueLower is better | 4th / 16 | 7.05 Price/1000 | +2.45 Price/1000 |
| Rolling ResistanceLower is better | 9th / 16 | 8.1 kg/t | +0.94 kg/t |
| Fuel ConsumptionLower is better | 8th / 16 | 5.58 l/100km | +0.23 l/100km |
- EU Label
- C/B/71
- 3PMSF
- Yes
- Price
- 395.00
Ceat 4 SeasonDrive+
225/45 R17 94V XL
Category scores (% of best)
All discipline results (17)
Discipline positions compare the ranked tires in this test, not the whole market. These are individual measurements, not weighted overall scores.
| Test | Position in discipline | Result | Gap to best |
|---|---|---|---|
| Dry BrakingLower is better | 10th / 16 | 134 ft | +10 ft |
| Dry HandlingHigher is better | 15th / 16 | 54.5 mph | -1.3 mph |
| Wet BrakingLower is better | 15th / 16 | 164 ft | +16 ft |
| Wet HandlingHigher is better | 14th / 16 | 44.0 mph | -3.3 mph |
| Wet CircleLower is better | 11th / 16 | 12.01 s | +0.39 s |
| Straight AquaHigher is better | 12th / 16 | 46.9 mph | -3.9 mph |
| Curved AquaplaningHigher is better | 14th / 16 | 9.3 ft/s² | -2.4 ft/s² |
| Snow BrakingLower is better | 14th / 16 | 80 ft | +6 ft |
| Snow TractionHigher is better | 14th / 16 | 564 lbf | -60 lbf |
| Snow HandlingHigher is better | 16th / 16 | 34.1 mph | -2.0 mph |
| Snow SlalomHigher is better | 16th / 16 | 11.7 ft/s² | -2.3 ft/s² |
| NoiseLower is better | 7th / 16 | 72.8 dB | +0.80 dB |
| Tire WeightLower is better | 16th / 16 | 85.3 lb | +10.3 lb |
| WearHigher is better | 7th / 16 | 32,282 miles | -14,342 miles |
| ValueLower is better | 2nd / 16 | 6.16 Price/1000 | +1.56 Price/1000 |
| Rolling ResistanceLower is better | 15th / 16 | 8.73 kg/t | +1.57 kg/t |
| Fuel ConsumptionLower is better | 10th / 16 | 5.65 l/100km | +0.30 l/100km |
- EU Label
- D/B/70
- 3PMSF
- Yes
- Price
- 320.00
Falken Euroall Season AS220 Pro
225/45 R17 94W XL
Category scores (% of best)
All discipline results (17)
Discipline positions compare the ranked tires in this test, not the whole market. These are individual measurements, not weighted overall scores.
| Test | Position in discipline | Result | Gap to best |
|---|---|---|---|
| Dry BrakingLower is better | 7th / 16 | 131 ft | +7 ft |
| Dry HandlingHigher is better | 5th / 16 | 55.2 mph | -0.6 mph |
| Wet BrakingLower is better | 4th / 16 | 151 ft | +3 ft |
| Wet HandlingHigher is better | 9th / 16 | 45.2 mph | -2.1 mph |
| Wet CircleLower is better | 6th / 16 | 11.9 s | +0.28 s |
| Straight AquaHigher is better | 10th / 16 | 47.3 mph | -3.5 mph |
| Curved AquaplaningHigher is better | 11th / 16 | 10.3 ft/s² | -1.4 ft/s² |
| Snow BrakingLower is better | 16th / 16 | 84 ft | +10 ft |
| Snow TractionHigher is better | 15th / 16 | 557 lbf | -67 lbf |
| Snow HandlingHigher is better | 13th / 16 | 34.7 mph | -1.4 mph |
| Snow SlalomHigher is better | 15th / 16 | 11.9 ft/s² | -2.1 ft/s² |
| NoiseLower is better | 11th / 16 | 73.1 dB | +1.10 dB |
| Tire WeightLower is better | 7th / 16 | 80.0 lb | +5.0 lb |
| WearHigher is better | 15th / 16 | 21,325 miles | -25,299 miles |
| ValueLower is better | 15th / 16 | 12.53 Price/1000 | +7.93 Price/1000 |
| Rolling ResistanceLower is better | 16th / 16 | 9.01 kg/t | +1.85 kg/t |
| Fuel ConsumptionLower is better | 9th / 16 | 5.64 l/100km | +0.29 l/100km |
- EU Label
- D/B/71
- 3PMSF
- Yes
- Price
- 430.00
Hello, how déterminante the wear of the tire please ?
You drive ex. 5000km and you calculate aploxymatly ?
Thanks
The estimated tread life is in the test data so you can do the math yourself.
For interest, I've made a chart I hope people find useful comparing performance vs cost.
Y-axis is mild climate rating (35% dry, 45% wet, 5% snow and 5% NVH - normalised, average of 2023 Auto Bild & 2023 Tire Reviews data).
X-axis is excess annual cost, i.e. the cheapest overall tire per year is £0, with every other tire showing the additional cost (this includes 4x tires purchase price/fitting in UK, wear and fuel costs all averaged over 1 year, wear and fuel economy data from 2023 Auto Bild test).
For reference, vehicle is a Honda Civic 1.8 i-VTEC petrol, averaging 41 mpg and 14000 miles per year with 205/55R16 tires.
Data obviously not perfect as some tires Conti ASC2 & Bridgestone TAS6 and others aren't included in the 2023 Tire Reviews test, but hopefully gives a good overall picture.
https://uploads.disquscdn.c...
Interesting visualization! We arrive at slighty different total costs -I wonder how that came-, but the trends are the same: the tires in the upper left quadrant seem to be the "best buys" - in this size, at least.
Interesting that they also measure wear and fuel consumption, that gives us a better idea of the TCO. So I wanted to find out how the TCO of the different tires compares.
I combined for each tire the price/wear value as indicated in the test, with the fuel consumption at a price of 1,85 €/l, which seems to be the european average fuel price. From that I calculated the cost / 1.000 km, and -to put things in perspective- the total cost difference after 50.000 km, compared with the most economical option.
If I change the price to 1,6 or 2,1 €/l, there isn't that much difference: the fuel saving tires like Michelin, Kleber and Bridgestone climb one or two places in the ranking when the fuel is more expensive, those with a bad fuel consumption drop one or two places.
Some interesting conclusions: if you buy the test winning Crossclimate, then it would after 50.000 km have cost you in total just +/- 50 € more than the tire with the cheapest TCO. That is less than 1% of your total (tires + fuel) budget. Driving the Falken or Vredestein will cost you more than 300 € extra, compared to the Michelin.
But this is just one test in one size. There can be big differences in the wear and fuel consumption results when the same tires are tested in different sizes: in other Autobild tests the Quatrac scores very good on wear and the Michelin/Kleber have a high fuel consumption. In reality, factors like your driving style will influence the TCO more than the mostly small variations that we see in this calculation. The main conclusion for me, is that in the end most “budget” and most top quality tires have about the same cost. That is if you don’t have an accident with your budget tires…
https://uploads.disquscdn.c...
Since I was in my nerd-trip, I also added a “driving and safety” score, that is based on the dynamic test results without fuel consumption and tire cost (and with a bit more weight on the wet performance). We see that -though the premium tires in general seem to perform better on the road- there is very little correlation between the TCO and the road qualities of the tires.
https://uploads.disquscdn.c...
This is excellent nerding! I've just scanned it for now, I'll try and take a deeper look next week. Thanks for sharing.
Thanks. If you are looking into it, you might want to compare with the results of last years AutoBild test (195/55R16). There the Kleber and Michelin are the most expensive tires in terms of TCO. A bit confusing, isn't it?
https://uploads.disquscdn.c...
..
Hello; Is it possible to get the spreadsheet so I could adjust those
results according to local prices in Poland? Good work anyway, greetings :)
No prob, but I can't send you the Excel file through this channel. I can e-mail it to you, if you want.
Of coz; Thank you v much; [email protected]
Hello; Didn't get your email; Did you send it? Greetings
Are the Kleber Quadraxer 3 and BFG Advantage All Season basically the same tire?
Tread patterns look identical and have very similar performance (Quadraxer has slightly better rolling resistance and wear though).
Both are owned by Michelin...
"Same technology. Some differences due to production machines types", whatever that means :)
it's a bit different