Highway terrain all season tires are probably the most important category of tire I've never tested. They're one of the biggest selling segments in North America, so it was about time I gave them the same treatment every other category gets.
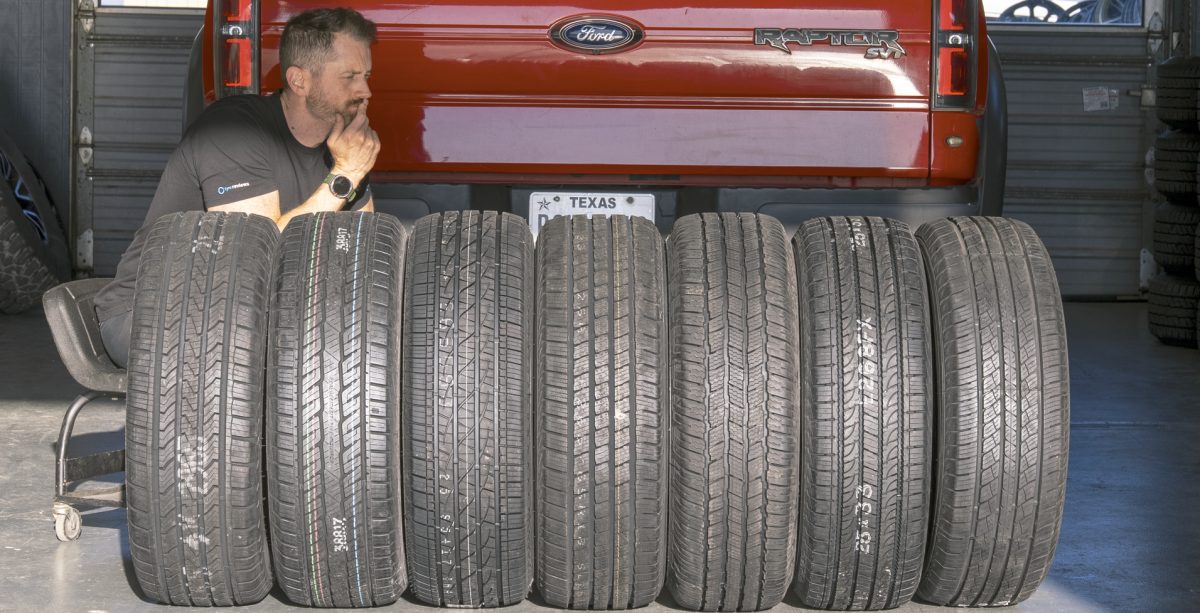
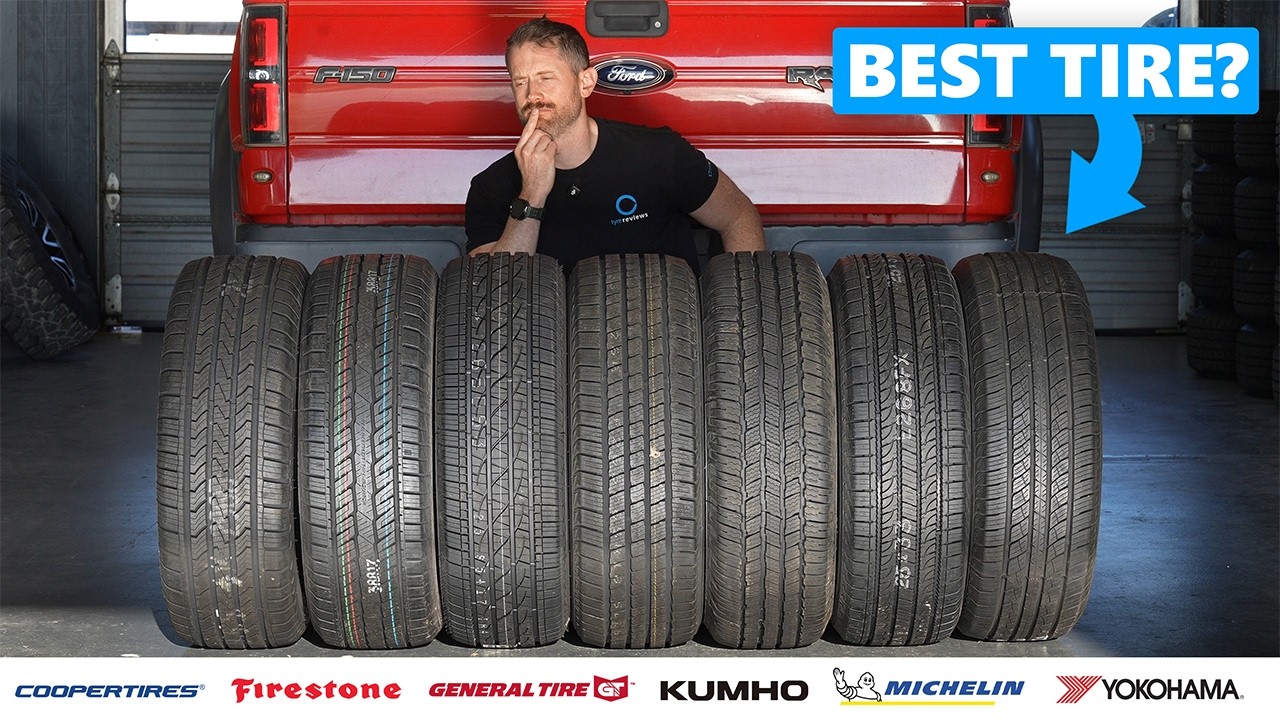
For this test I picked seven of the most popular HTs on sale today, all in 265/65 R18, spanning pretty much every price point you'll find at a US tire shop. There's the segment benchmark - the Michelin Defender LTX M/S2 - alongside the brand-new General Grabber HT, mid-range options from Cooper (Endeavor Plus), Firestone (Destination LE3), Kumho (Crugen HT51) and Yokohama (Geolandar HT G056), and a budget tire in the Westlake SU318 HT to find out how far cheap has come. The question I wanted to answer is the one I think most truck owners are asking: does spending more money actually mean a better tire?
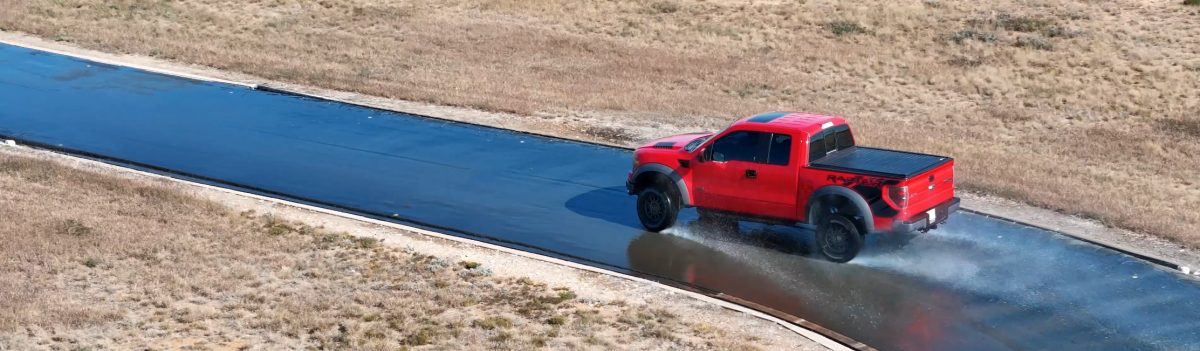
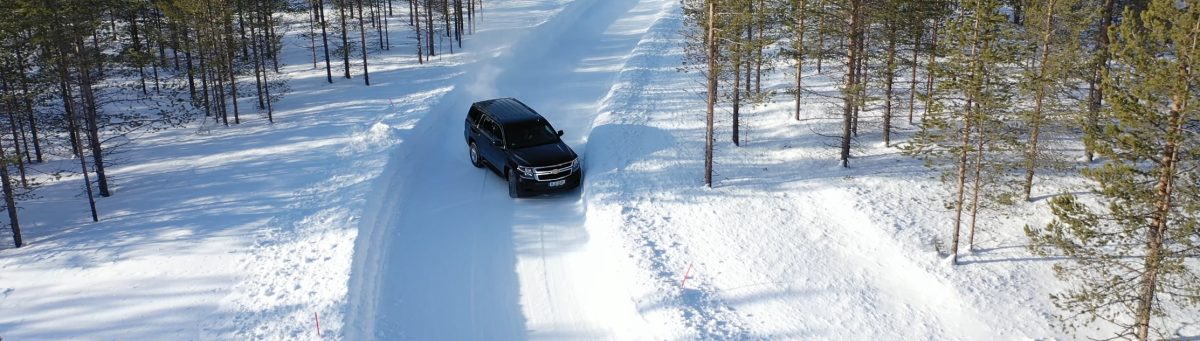
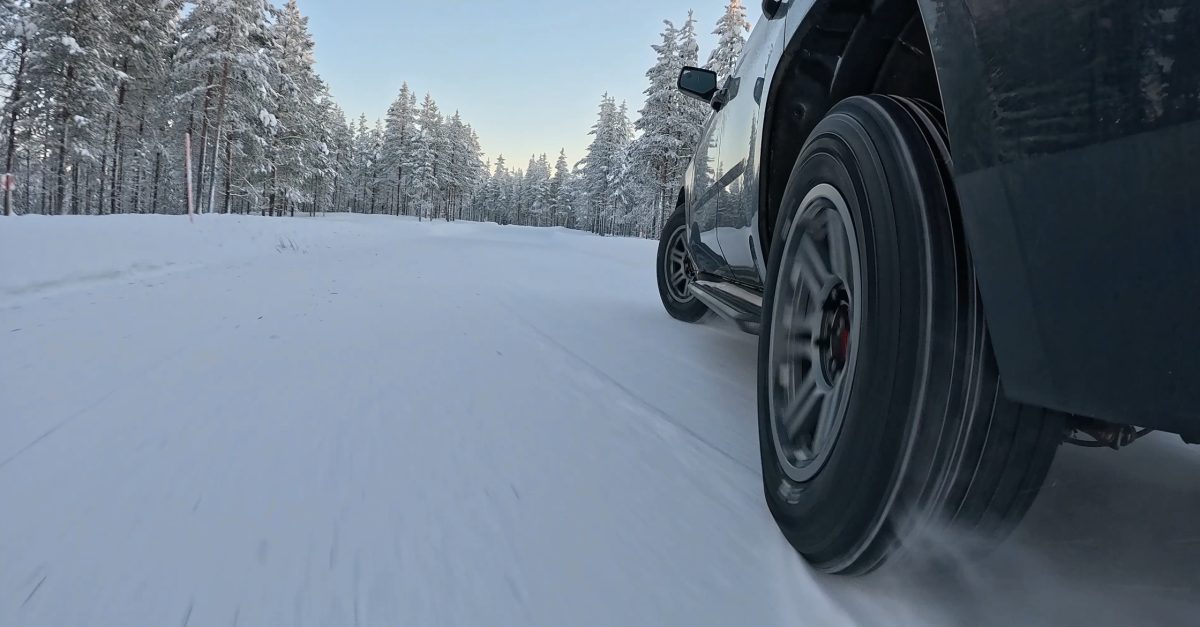
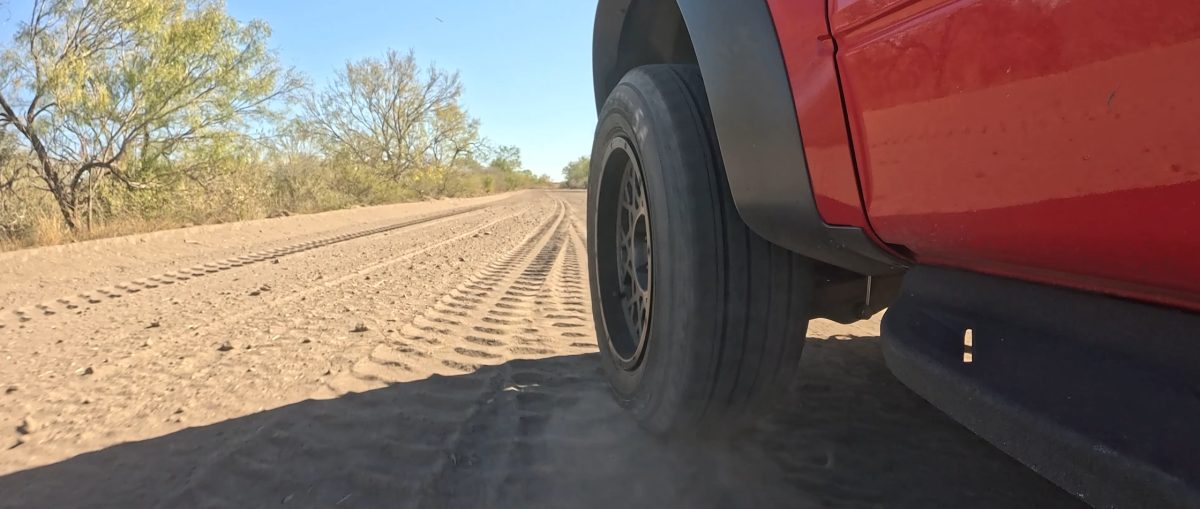
The dry, wet and dirt sessions were run on a Ford Raptor at the proving ground. For snow I flew the set to northern Sweden and bolted them to a Tahoe. Every tire was then scored on dry braking and handling, wet braking, handling, straight and curved aquaplaning, snow braking, traction, handling and cornering, comfort, noise, rolling resistance, and cost per 1,000 miles based on the tread warranty. The full results are below - and as always, you can change the score weighting to match your own driving conditions to find the right HT for you.
Testing Methodology
Test Driver
Jonathan Benson
Tire Size
265/65 R18
Test Vehicle
Ford Raptor SVT / Taheo
Test Location
Professional Proving Ground
Test Year
2026
Tires Tested
7
Show full testing methodologyHide methodology
Every tire is tested using calibrated instrumented measurement and structured subjective assessment. Reference tires are retested throughout each session to correct for changing conditions, ensuring fair, repeatable comparisons. Multiple reference sets are used where needed so that control tire wear does not affect accuracy.
We use professional-grade testing equipment including GPS data loggers, accelerometers, and calibrated microphones. All tires are broken in and conditioned before testing begins. For full details on our equipment, preparation process, and calibration procedures, see our complete testing methodology.
Categories Tested
Dry Braking
For dry braking, I drive the test vehicle at an entry speed of 110 km/h and apply full braking effort to a standstill with ABS active on clean, dry asphalt. I typically use an 100–5 km/h measurement window. My standard programme is five runs per tire set where possible, although the sequence can extend to as many as fifteen runs if conditions and tire category justify it. I analyse the full set of runs and discard statistical outliers before averaging. Reference tires are run repeatedly throughout the session to correct for changing conditions.
Dry Handling
For dry handling, I drive at the limit of adhesion around a dedicated handling circuit with ESC disabled where possible so I can assess the tire's natural balance, transient response, and limit behaviour without electronic intervention masking the result. I usually complete between two and five timed laps per tire set, depending on the circuit, tire type, and consistency of conditions. I exclude laps affected by clear driver error or obvious environmental inconsistency. Control runs are carried out frequently throughout the session, and I often use multiple sets of control tires so that wear on the references does not become a meaningful variable. For more track-focused products, I also do endurance testing, which is a set number of laps at race pace to determine tire wear patterns and heat resistance over longer driving.
Wet Braking
For wet braking, I drive the test vehicle at an entry speed of 88 km/h and apply full braking effort to a standstill with ABS active on an asphalt surface with a controlled water film. I typically use an 80–5 km/h measurement window to isolate tire performance from variability in the initial brake application. My standard programme is eight runs per tire set where possible, although the sequence can extend to as many as fifteen runs if conditions and tire category justify it. I analyse the full set of runs and discard statistical outliers before averaging. To correct for changing conditions, I run reference tires repeatedly throughout the session — in wet testing, typically every three candidate test sets.
Wet Handling
For wet handling, I drive at the limit of adhesion around a dedicated handling circuit. I generally use specialist wet circuits with kerb-watering systems designed to maintain a consistent surface condition. ESC is disabled where possible so I can assess the tire's natural balance, transient response, and limit behaviour without electronic intervention masking the result. I usually complete between two and five timed laps per tire set, depending on the circuit, tire type, and consistency of conditions. I exclude laps affected by clear driver error or obvious environmental inconsistency. Control runs are carried out frequently throughout the session, and I often use multiple sets of control tires so that wear on the references does not become a meaningful variable.
Subj. Wet Handling
Objective data is only part of the picture, so I also carry out a structured subjective handling assessment at the limit of adhesion on a dedicated wet handling circuit. I score steering precision, steering response, turn-in behaviour, mid-corner balance, aquaplaning resistance, breakaway characteristics, and overall confidence using a standardised 1–10 scale used consistently across my testing. The final assessment combines numeric scoring with written technical commentary. I complete familiarisation laps on the control tire before evaluating each candidate.
Wet Circle
For wet lateral grip testing, I use a circular track of fixed radius, typically between 30 and 50 metres, broadly aligned with ISO 4138 principles. The surface is wetted in a controlled and repeatable manner. I progressively increase speed until the maximum sustainable cornering speed is reached. I normally record multiple laps in both clockwise and counterclockwise directions to reduce the influence of camber, banking, or directional track bias. I then calculate average lateral acceleration and compare the result with the reference tire.
Straight Aqua
To measure straight-line aquaplaning resistance, I drive one side of the vehicle through a water trough of controlled depth, typically around 7 mm, while the opposite side remains on dry pavement. I enter at a fixed speed and then accelerate progressively. I define aquaplaning onset as the point at which the wheel travelling through the water exceeds a specified slip threshold relative to the dry-side reference wheel. I usually perform four runs per tire set and average the valid results.
Curved Aquaplaning
For curved aquaplaning, I use a circular track, typically around 100 metres in diameter, with a flooded arc of controlled water depth, usually about 7 mm. The vehicle is instrumented with GPS telemetry and a tri-axial accelerometer. I drive through the flooded section at progressively increasing speed, typically in 5 km/h increments, and record the minimum sustained lateral acceleration at each step. The test continues until lateral acceleration collapses, indicating complete aquaplaning. The result is expressed as remaining lateral acceleration in m/s² as speed rises.
Snow Braking
For snow braking, I drive the test vehicle at an entry speed of 50 km/h and apply full braking effort to a standstill with ABS active on a groomed, compacted snow surface, measuring 45-5 km/h. I generally use a wide VDA (vehicle dynamic area) and progressively move across the surface between runs so that no tire ever brakes on the same piece of snow twice. My standard programme is twelve runs per tire set, although the sequence can extend further if the data justify it. I analyse the full set of runs and discard statistical outliers before averaging. The surface is regularly groomed throughout the session. To correct for changing snow surface conditions, I run reference tires repeatedly — typically every two candidate test sets.
Snow Traction
For snow traction, I accelerate the vehicle from rest on a groomed snow surface with traction control active and measure speed and time using GPS telemetry. I typically use a 5–35 km/h measurement window to reduce the influence of launch transients and powertrain irregularities. I use a wide VDA (vehicle dynamic area) and progressively move across the surface between runs so that no tire ever accelerates on the same piece of snow twice. The surface is regularly groomed throughout the session. I complete multiple runs per tire set and average the valid results. Reference tires are run typically every two candidate test sets to correct for changing snow surface conditions.
Snow Handling
For snow handling, I drive at the limit of adhesion around a dedicated snow handling circuit with ESC disabled where possible. The circuit is groomed and prepared after every run while tires are being changed, so each set runs on a consistently prepared surface. I usually complete between two and five timed laps per tire set, excluding laps affected by clear driver error or obvious environmental inconsistency. Because snow surfaces degrade more rapidly than asphalt, control runs are carried out more frequently — typically every two candidate test sets.
Subj. Snow Handling
Objective data is only part of the picture, so I also carry out a structured subjective handling assessment at the limit of adhesion on a dedicated snow handling circuit. The circuit is groomed and prepared after every run while tires are being changed, so each set runs on a consistently prepared surface. I score steering precision, turn-in behaviour, mid-corner balance, corner-exit traction, breakaway characteristics, and overall confidence on snow using a standardised 1–10 scale used consistently across my testing. The final assessment combines numeric scoring with written technical commentary. I complete familiarisation laps on the control tire before evaluating each candidate.
Snow Cornering
For snow cornering, I drive the test vehicle through dedicated snow cornering sections at progressively increasing speeds. The surface is regularly groomed throughout the session. Lateral acceleration is measured using GPS telemetry and accelerometers. Multiple runs are averaged. Because snow surfaces degrade more rapidly, the control tire is retested frequently to account for changing conditions.
Dirt Handling
For dirt handling, I drive at the limit of adhesion around a dedicated dirt handling course with ESC typically disabled. I complete multiple timed laps per tire set, excluding laps affected by driver error or environmental inconsistency. Because natural surfaces are inherently variable, I place particular emphasis on repeat runs, careful reference tracking, and averaged results. The control tire is retested at regular intervals.
Subj. Dirt Handling
Objective data is only part of the picture, so I also carry out a structured subjective handling assessment on a dedicated dirt course. I score steering feel, traction, stability, breakaway characteristics, and overall confidence using a standardised 1–10 scale used consistently across my testing. The final assessment combines numeric scoring with written technical commentary. I complete familiarisation laps on the control tire before evaluating each candidate.
Subj. Comfort
To assess comfort, I drive on a wide range of road surfaces (often dedicated comfort tracks at test facilities) at speeds from 50 to 120 km/h, including smooth motorway, coarse surfaces, expansion joints, broken pavement, and sharp-edged obstacles. I evaluate primary ride quality, secondary ride quality, impact harshness, seat-transmitted vibration, and the tire's ability to absorb sharp inputs. Ratings are assigned on a 1–10 scale relative to the reference tire.
Noise
I measure external pass-by noise in accordance with UNECE Regulation 117 and ISO 13325 using the coast-by method on a compliant test surface. Calibrated microphones are positioned beside the test lane, and the vehicle coasts through the measurement zone under controlled conditions. I record the maximum A-weighted sound pressure level in dB(A), complete multiple runs over the relevant speed range, and normalise the result to the reference speed required by the procedure.
Rolling Resistance
Rolling resistance is measured under controlled laboratory conditions in accordance with ISO 28580 and UNECE Regulation 117 Annex 6. The tire is mounted on a test wheel and loaded against a large-diameter steel drum. After thermal stabilisation at the prescribed test speed, rolling resistance force is measured at the spindle and corrected according to the relevant procedure. The result is expressed as rolling resistance coefficient, typically in kg/tonne.
How each category is weighted in the overall score:
Dry30%
Dry Braking60%
Dry Handling40%
Wet40%
Wet Braking50%
Wet Handling20%
Subj. Wet Handling5%
Wet Circle10%
Straight Aqua10%
Curved Aquaplaning5%
Off road5%
Dirt Handling50%
Subj. Dirt Handling50%
Snow10%
Snow Braking40%
Snow Traction20%
Snow Handling30%
Subj. Snow Handling5%
Snow Cornering5%
Comfort8%
Subj. Comfort50%
Noise50%
Value8%
Value60%
Rolling Resistance40%
Dry Braking
The General Grabber HT had the shortest dry stop at 39.89 metres, with the Firestone Destination LE3 just over half a metre behind. The Michelin Defender LTX M/S2 was the surprise here, slipping to seventh - though best-to-worst was less than three metres, so the spread isn't huge.
Dry Braking
Spread: 2.95 M (7.4%)|Avg: 41.26 M
Dry braking in meters (100 - 0 km/h) (Lower is better)
General Grabber HT
39.89 M
Firestone Destination LE3
40.43 M
Yokohama Geolandar HT G056
40.81 M
Cooper Endeavor Plus
41.10 M
Westlake SU318 HT
41.60 M
Kumho Crugen HT51
42.12 M
Michelin Defender LTX MS2
42.84 M
Dry Handling
I didn't run dry handling myself - the Raptor really wasn't the right tool for the job - so a colleague drove the laps. The Westlake SU318 HT was actually the fastest tire, with the Yokohama and Cooper tied a tenth behind, and the entire field covered just 1.1 seconds. Dry lap time was not where this test was decided.
Dry Handling
Spread: 1.10 s (1.9%)|Avg: 59.29 s
Dry handling time in seconds (Lower is better)
Westlake SU318 HT
58.60 s
Yokohama Geolandar HT G056
59.20 s
Cooper Endeavor Plus
59.20 s
Michelin Defender LTX MS2
59.30 s
General Grabber HT
59.40 s
Kumho Crugen HT51
59.60 s
Firestone Destination LE3
59.70 s
Wet Braking
As with dry braking, the General Grabber HT topped the chart in the wet, this time with the Cooper Endeavor Plus close behind. The Westlake and Michelin sat at the bottom of the field, both around five metres adrift of the General - for a benchmark premium tire, the Michelin's wet braking result is genuinely disappointing.
Wet Braking
Spread: 4.99 M (9.1%)|Avg: 57.15 M
Wet braking in meters (80 - 0 km/h) (Lower is better)
General Grabber HT
54.75 M
Cooper Endeavor Plus
55.10 M
Firestone Destination LE3
56.17 M
Kumho Crugen HT51
56.18 M
Yokohama Geolandar HT G056
58.66 M
Michelin Defender LTX MS2
59.43 M
Westlake SU318 HT
59.74 M
Wet Handling
Wet handling told a clear story. The General Grabber HT and Firestone Destination LE3 were essentially tied at the top - both were fabulous to drive, with the General slightly easier thanks to a wider window of grip when sliding.
The Michelin came third with a progressive, easy-to-drive character, but it felt a touch lazy on the steering and didn't have the outright grip of the top two. The Cooper and Kumho posted nearly identical times, but I preferred the Cooper - the Kumho let go a little more abruptly, which made it harder to read at the limit. The Westlake's outright grip was actually OK for its price point, but it was the hardest tire to drive in the field: when it broke away, it broke away suddenly and without much warning. The Yokohama was the worst, and was the real surprise of the day - I was running semi-blind and within two corners had assumed I was on the budget tire. It spun up easily, slid early, and took a long time to recover. Yokohama needs to improve this tire's wet grip.
Wet Handling
Spread: 6.77 s (8.4%)|Avg: 82.94 s
Wet handling time in seconds (Lower is better)
General Grabber HT
80.41 s
Firestone Destination LE3
80.49 s
Michelin Defender LTX MS2
82.12 s
Cooper Endeavor Plus
82.55 s
Kumho Crugen HT51
83.15 s
Westlake SU318 HT
84.70 s
Yokohama Geolandar HT G056
87.18 s
Straight Aquaplaning
The General Grabber HT was first off the floats at 90.24 km/h, with the Firestone, Kumho and Michelin clustered just behind. The Westlake floated earliest, with the Yokohama not far ahead of it.
Straight Aqua
Spread: 1.88 Km/H (2.1%)|Avg: 89.34 Km/H
Float Speed in Km/H (Higher is better)
General Grabber HT
90.24 Km/H
Firestone Destination LE3
89.71 Km/H
Kumho Crugen HT51
89.63 Km/H
Michelin Defender LTX MS2
89.63 Km/H
Cooper Endeavor Plus
89.03 Km/H
Yokohama Geolandar HT G056
88.77 Km/H
Westlake SU318 HT
88.36 Km/H
Curved Aquaplaning
A near-complete reversal of the straight aquaplaning order - the Cooper Endeavor Plus held the most lateral grip on standing water, with the Michelin and Kumho close behind. The General, dominant in straight-line aqua and wet handling, was actually last in this test, which is worth knowing if you regularly drive flooded curves.
Curved Aquaplaning
Spread: 0.44 m/sec2 (12.8%)|Avg: 3.26 m/sec2
Remaining lateral acceleration (Higher is better)
Cooper Endeavor Plus
3.44 m/sec2
Michelin Defender LTX MS2
3.38 m/sec2
Kumho Crugen HT51
3.34 m/sec2
Firestone Destination LE3
3.24 m/sec2
Westlake SU318 HT
3.22 m/sec2
Yokohama Geolandar HT G056
3.19 m/sec2
General Grabber HT
3.00 m/sec2
Snow Braking
The Firestone Destination LE3 just edged the Michelin to win snow braking, separated by only 0.02 of a metre. The Westlake and Kumho tied at the back, more than a metre adrift of the leaders.
Snow Braking
Spread: 1.29 M (7.1%)|Avg: 18.82 M
Snow braking in meters (40 - 5 km/h) [Average Temperature -16c] (Lower is better)
Snow Braking: Safety Impact: Best vs Worst Tire
Snow Traction
The Kumho Crugen HT51 was on another level here, posting a traction time 0.2 seconds clear of the Michelin in second - its straight-line acceleration on snow was unbelievable compared to anything else in the test. The Westlake was last, with the Yokohama and General both further down the field than I'd have liked to see.
Snow Traction
Spread: 1.38 s (45.1%)|Avg: 3.71 s
Snow acceleration time (0 - 20 km/h) [Average Temperature -20c] (Lower is better)
Kumho Crugen HT51
3.06 s
Michelin Defender LTX MS2
3.26 s
Firestone Destination LE3
3.31 s
Cooper Endeavor Plus
3.82 s
General Grabber HT
3.94 s
Yokohama Geolandar HT G056
4.13 s
Westlake SU318 HT
4.44 s
Snow Handling
The Michelin Defender LTX M/S2 took the snow handling lap time, with the Firestone right behind - the Firestone surprised me by running the Michelin that close, as I'd expected the Michelin to walk away with this one.
The Cooper and General were both happy in winter conditions for all-season tires, with the General slightly more chuckable past the limit. The Kumho was a strange one to drive - straight-line traction was incredible, but as soon as you arrived at a corner the front end just didn't want to turn. Straight to the scene of the accident, as I put it at the time. The Westlake was actually surprisingly grippy for its price point, with a rounded grip circle and predictable breakaway. The Yokohama was last by a clear margin and was a nervous, low-confidence tire throughout the snow programme. Worth keeping in mind these are all-season tires - if you live anywhere with serious winter, a dedicated winter tire will absolutely embarrass any of them.
Snow Handling
Spread: 4.14 s (4.7%)|Avg: 89.37 s
Snow handling time in seconds (Lower is better)
Michelin Defender LTX MS2
87.23 s
Firestone Destination LE3
87.72 s
Cooper Endeavor Plus
88.75 s
General Grabber HT
89.44 s
Kumho Crugen HT51
89.89 s
Westlake SU318 HT
91.19 s
Yokohama Geolandar HT G056
91.37 s
Snow Cornering
The Firestone, Michelin and Cooper held the highest cornering G on snow and were tightly grouped at the top. The Kumho slipped to joint last with the Westlake - exactly what its handling lap suggested, with the strong straight-line traction undone by weak lateral grip.
Snow Cornering
Spread: 0.03 g (8.8%)|Avg: 0.33 g
Average Lateral Acceleration in G [Average Temperature -13.5c] (Higher is better)
Firestone Destination LE3
0.34 g
Michelin Defender LTX MS2
0.34 g
Cooper Endeavor Plus
0.34 g
General Grabber HT
0.33 g
Yokohama Geolandar HT G056
0.32 g
Kumho Crugen HT51
0.31 g
Westlake SU318 HT
0.31 g
Dirt Handling
Dirt handling was tight across the board, but a few tires stood out. The Cooper Endeavor Plus posted the fastest objective lap, with the Kumho and Michelin a couple of tenths behind - though subjectively, the Michelin Defender LTX was the nicest to drive by a wide margin. It didn't have any more outright grip than the others, but the truck steered exactly as much as you asked it to and slid in a rounded, predictable way.
The General was the best of the rest subjectively, with good traction and lateral grip. The Yokohama had the most reactive steering of the field but didn't have the traction to back it up, and I caught it half-spinning a couple of times because I just couldn't read what the tire was doing underneath. The Westlake was easy to drive but plainly didn't have the grip - it was significantly down on lap time despite feeling rounded. Honestly, on reflection I don't think dirt handling is the most relevant test for a highway terrain tire - for future tests I'll be moving to a traction-focused off-road test instead.
Dirt Handling
Spread: 1.82 s (3%)|Avg: 60.92 s
Dirt handling time in seconds (Lower is better)
Cooper Endeavor Plus
60.20 s
Kumho Crugen HT51
60.44 s
Michelin Defender LTX MS2
60.65 s
Firestone Destination LE3
60.66 s
General Grabber HT
60.91 s
Yokohama Geolandar HT G056
61.53 s
Westlake SU318 HT
62.02 s
Subjective Comfort
The General Grabber HT scored highest for ride comfort, with the Kumho and Cooper close behind, and the Westlake last. Worth flagging that comfort testing on an old Raptor is far from the cleanest data point, which is why I cross-checked it against a colleague's scores.
Subj. Comfort
Spread: 0.70 Points (10.3%)|Avg: 6.44 Points
Subjective Comfort Score (Higher is better)
General Grabber HT
6.80 Points
Kumho Crugen HT51
6.60 Points
Cooper Endeavor Plus
6.60 Points
Michelin Defender LTX MS2
6.40 Points
Yokohama Geolandar HT G056
6.30 Points
Firestone Destination LE3
6.30 Points
Westlake SU318 HT
6.10 Points
Noise
The Westlake measured quietest on the external pass-by test at 72.4 dB, with the Michelin the loudest at 75.8 dB. From inside the cabin during my own subjective drives, I honestly didn't pick out any of the tires as noticeably louder than each other - external noise figures don't always translate to what you actually hear behind the wheel.
Noise
Spread: 3.40 dB (4.7%)|Avg: 74.26 dB
External noise in dB (Lower is better)
Westlake SU318 HT
72.40 dB
Cooper Endeavor Plus
73.00 dB
Yokohama Geolandar HT G056
74.20 dB
Firestone Destination LE3
74.40 dB
General Grabber HT
74.90 dB
Kumho Crugen HT51
75.10 dB
Michelin Defender LTX MS2
75.80 dB
Value
The Westlake's low purchase price gives it a clear win on cost per 1,000 warranted miles - assuming it actually reaches its 50,000-mile warranty. The Michelin is the most expensive tire on this metric, mostly because of its high purchase price, even though it carries the longest 75,000-mile warranty in the test.
Dollars/1000 miles based on mileage warranty (Lower is better)
Westlake SU318 HT
2.24 Price/1000
Kumho Crugen HT51
2.63 Price/1000
General Grabber HT
2.97 Price/1000
Firestone Destination LE3
3.01 Price/1000
Cooper Endeavor Plus
3.06 Price/1000
Yokohama Geolandar HT G056
3.22 Price/1000
Michelin Defender LTX MS2
3.72 Price/1000
Rolling Resistance
The Michelin Defender LTX M/S2 had the lowest rolling resistance of the field, with the Firestone Destination LE3 second - so the Michelin's high purchase price is partly offset by lower fuel use over the life of the tire. The Westlake has the highest rolling resistance in the test, working against its already-cheap purchase price the longer you keep it on the truck.
Rolling Resistance
Spread: 2.39 kg / t (34.4%)|Avg: 8.23 kg / t
Rolling resistance in kg t (Lower is better)
Michelin Defender LTX MS2
6.94 kg / t
Firestone Destination LE3
7.70 kg / t
Kumho Crugen HT51
7.93 kg / t
Cooper Endeavor Plus
8.35 kg / t
General Grabber HT
8.43 kg / t
Yokohama Geolandar HT G056
8.92 kg / t
Westlake SU318 HT
9.33 kg / t
19,000 km
£1.45/L
8.0 L/100km
--
Annual Difference
--
Lifetime Savings
--
Extra Fuel/Energy
--
Extra CO2
Estimates based on typical driving conditions. Rolling resistance accounts for approximately 20% of IC vehicle fuel consumption and 25% of EV energy consumption. Actual savings vary based on driving style, vehicle weight, road conditions, and tire age. For comparative purposes only. Lifetime savings based on a 40,000km / 25,000 mile tread life.
Results
The new General Grabber HT takes the overall win on the strength of class-leading wet and dry braking and the best wet handling, narrowly ahead of an all-round Firestone Destination LE3. The Yokohama Geolandar HT G056 finishes last after struggling in the wet and the snow, and while the Westlake SU318 HT was last in most performance disciplines, its strong value score lifted it out of the bottom spot.
Best in test for wet and dry braking, with very strong wet grip and a high comfort score that makes it easy to recommend.
Not the best on curved aquaplaning, and it's only mid-pack for rolling resistance and measured noise.
The new General Grabber HT takes the win by a small margin by acing dry and wet braking, having the best wet lateral grip, being good enough in the snow, though I would like to see a little more snow traction, and by having good comfort levels. It's rolling resistance is a little high and it didn't do great in curved aquaplaning, but both objectively and subjectively it's a really nice on road product.
Very strong across wet and snow, with class-leading snow braking and cornering grip, and a low rolling resistance.
Dry handling was the slowest in the test, though margins were small, and on dirt it didn't feel as progressive as the best tires.
The Firestone Destination LE3 is a very strong tire. It was the best overall in the wet, good in all braking tests with the best snow braking AND the second lowest rolling resistance. On dirt it wasn't quite as drivable as some of the other tires but I don't really think that matters for this catoroy of tire. Fantastic product.
A well-rounded tire that was quickest on dirt, very strong in curved aquaplaning, and consistently near the front across most tests.
Not quite as quick as the leaders in the wet, and it sits mid-pack for rolling resistance and purchase price.
The Cooper Endeavor Plus worked its way into the top 3 not by excelling in any single area, but by just being a really solid all round tire. Good in the dry, good in the wet with very good wet braking and great aquaplaning resistance, and while it didn't really excel in the snow it also it didn't have any massive red marks against it. It was also great in the dirt and had good comfort. Recommended.
Best snow traction in the test with a respectable overall balance for the money.
Dry braking and snow braking were near the back, and it didn't score especially well for subjective snow feel or noise.
The Kumho Crugen HT51 is a solid tire, if not a little inconsistent. It struggled in the dry tests and was a little tricky to drive in the wet, and while it had good comfort and was good value overall, it's amazing snow traction and average snow everything else made for an interesting experience. Like the Michelin it's a good tire, it just needs some refining to be at the front of tests.
Best rolling resistance and very strong on snow and subjective wet feel, with calm, easy-to-drive behaviour noted across surfaces.
Wet and dry braking were both near the back, and it was the loudest tire on the external noise test. Also, expensive.
The Michelin Defender LTX M/S2 is a strong product, easy to drive in all conditions, has mega snow grip for its class and uses the least fuel. Even with all those strengths, it was outclassed in the wet and dry, noticeably the braking tests which are so critical in test scoring, and from a purchase price to warranted value proposition, it's by far the most expensive here. It's a refined tire with strong winter grip I'd still recommend to people, but I want to see more wet grip for the next version of it.
Cheapest tire in the test with the quietest external noise, plus the fastest dry handling lap time.
Worst overall for wet braking, snow traction, rolling resistance and dirt handling, and it was the hardest tire to drive cleanly in the wet.
The Westlake SU318 HT was included as I thought it would highlight how bad cheap tires are, which it did to a point, but it was WAY better than I expected it to be. That said, it was still last overall in the wet, last overall in snow, last overall in dirt, the worst subjective comfort, the highest rolling resistance. But it was the fastest around the dry handling lap! The value result really helped not finish in last place overall, And honestly while it isn't a great tire, assuming it doesn't wear out very quickly, it does present a somewhat interesting value proposition.
Decent dry performance and a reasonably low noise level.
Worst wet handling and worst snow handling, with below-average results across most wet and snow metrics.
In last place was the Yokohama Geolander HT G056. Sadly it never really recovered from its wet performance where it really struggled, and the story was mostly the same in the snow too. In fact, it wasn't super comfortable, it had a high rolling resistance, and its warranted price per 1000 miles was also on the higher side. Not a great test for this tire, I've come to expect more from Yokohama but at this point it is a very old tire.
I believe the problem with the Platinum is a very limited size range. It's really for the big stuff. But I'll try to keep doing more of these in the future.
I have not watched the YouTube video yet, I'm at work. But man, Michelin barely made the recommendation cutoff. Which is wild! I suspect their focus is too much on longevity.
I agree. I suspect if wear had actually been tested, Michelin would have been very strong there. They also lean into snow quite a lot more than some of the other products, which hurts wet and dry braking in particular which is so important in test score weighting
A confusing choice by Michelin. No 3 peak rating ( which it would easily qualify for), Guessing to not compete with cross climate. But they are dealing with the tradeoffs of stellar winter performance.

Especially this little guy.
Michelin Defender Ltx Platinum
I have not watched the YouTube video yet, I'm at work. But man, Michelin barely made the recommendation cutoff. Which is wild! I suspect their focus is too much on longevity.