Auto motor und sport tested eight summer tires in size 195/55 R 16, a common fitment for small cars such as the VW Polo, Hyundai i20, Fiat 500, and Renault Clio, including several electric models like the Hyundai Inster and Fiat 500e. Testing covered wet performance (braking, handling, aquaplaning), dry performance (braking, handling, steering response, comfort), and environmental factors (rolling resistance, noise). The test used both a conventional Hyundai i20 and a battery-electric Hyundai Inster, with a separate EV-focused rating that weighted efficiency more heavily.
The Dunlop Blue Response TG - a newly developed tire from Sumitomo/Falken following their acquisition of the Dunlop brand - took a clear overall win with the only "outstanding" rating, finishing first in most wet and dry tests. At the other end, the Giti Synergy H2 finished last despite carrying an A/A/A EU label (the best possible in all three categories), with the testers concluding that the label ratings were far more optimistic than the actual measured performance. The Continental EcoContact 6 highlighted the core trade-off in this test: it delivered the lowest rolling resistance and longest EV range by a wide margin, but paid for it with the worst wet braking distance - sliding 6.4 metres further than the Dunlop on wet surfaces.
Test Publication:
Sport Auto
195/55 R16
8 tires
4 categories
Test Size:
195/55 R16
Tires Tested:
8 tires
Sport Auto is not affiliated with, and does not endorse, Tire Reviews. This is independent editorial coverage of their published test.
Dry
The Dunlop stopped shortest at 34.9 metres from 100 km/h, with the Falken close behind at 35.5 metres. The spread is relatively tight - only 2.6 metres separates best from worst - but the Cooper trailed the field at 37.5 metres, a result the testers described as borderline.
- Dunlop Blue Response TG
- Falken e.Ziex
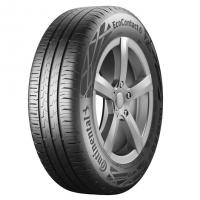
- Continental EcoContact 6
- Vredestein Ultrac plus
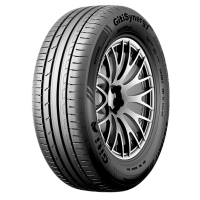
- Giti GitiSynergyH2
- Firestone Roadhawk 2 ENLITEN
- Michelin Primacy 5
- Cooper Summer
Handling lap times on the 1900-metre dry track were closely bunched, with just 1.0 km/h covering the entire field. The Dunlop was fastest, followed by the Giti and Continental in a dead heat. Vredestein was slowest on the clock, though the testers noted that lap times only tell part of the story - subjective scores for steering precision and limit behaviour varied more widely, with the Dunlop, Continental, and Michelin rated highest for driving feel.
- Dunlop Blue Response TG
- Continental EcoContact 6
- Giti GitiSynergyH2
- Falken e.Ziex
- Firestone Roadhawk 2 ENLITEN
- Michelin Primacy 5
- Cooper Summer
- Vredestein Ultrac plus
Wet
Wet braking showed the largest performance gaps in the entire test. The Vredestein stopped first at 35.5 metres from 80 km/h, with the Dunlop just one metre behind. At the other end, the Giti needed 43.8 metres - over 8 metres further, which the testers called unacceptably long. The Continental, despite being the efficiency leader, also struggled here at 42.9 metres, paying for its low rolling resistance with an 18% longer braking distance than the Dunlop.
- Vredestein Ultrac plus
- Dunlop Blue Response TG
- Firestone Roadhawk 2 ENLITEN
- Michelin Primacy 5
- Falken e.Ziex
- Cooper Summer
- Continental EcoContact 6
- Giti GitiSynergyH2
The Dunlop led wet handling on the 1823-metre circuit at 55.8 km/h, with Firestone and Vredestein close behind. The Continental was slowest at 52.4 km/h - consistent with its weak wet braking - and the Giti also struggled near the bottom. The efficiency-focused tires clearly lost ground when grip mattered most.
- Dunlop Blue Response TG
- Firestone Roadhawk 2 ENLITEN
- Vredestein Ultrac plus
- Michelin Primacy 5
- Falken e.Ziex
- Cooper Summer
- Giti GitiSynergyH2
- Continental EcoContact 6
Lateral grip on the wet 100-metre circle followed a similar pattern, with the Dunlop recording the highest cornering force and the Continental the lowest. The gap between them - 0.33 m/s² - is significant for a standardised circle test and reinforces the trade-off between rolling resistance and wet grip seen throughout this test.
- Dunlop Blue Response TG
- Vredestein Ultrac plus
- Falken e.Ziex
- Firestone Roadhawk 2 ENLITEN
- Cooper Summer
- Giti GitiSynergyH2
- Michelin Primacy 5
- Continental EcoContact 6
The Dunlop and Michelin were nearly identical for straight-line aquaplaning resistance, floating up at 92.2 and 92.1 km/h respectively. The Continental was weakest at 81.8 km/h - over 10 km/h behind the leaders. The testers observed that low-rolling-resistance tires tended to aquaplane earlier, which aligns with the broader trend in this test.
- Dunlop Blue Response TG
- Michelin Primacy 5
- Vredestein Ultrac plus
- Cooper Summer
- Firestone Roadhawk 2 ENLITEN
- Falken e.Ziex
- Giti GitiSynergyH2
- Continental EcoContact 6
Curved aquaplaning reversed some of the usual order: the Firestone posted the best lateral grip before float at 4.78 m/s², while the Continental was again last at 3.20 m/s². The Dunlop, dominant in most other wet tests, was mid-pack here at 4.28 m/s².
- Firestone Roadhawk 2 ENLITEN
- Michelin Primacy 5
- Cooper Summer
- Dunlop Blue Response TG
- Vredestein Ultrac plus
- Falken e.Ziex
- Giti GitiSynergyH2
- Continental EcoContact 6
Comfort
Pass-by noise at 80 km/h ranged from 68.7 dB(A) for the Dunlop to 71.9 dB(A) for the Cooper - a 3.2 dB(A) spread. The testers noted that the standard ECE exterior noise measurement does not capture low-speed rolling noise below 60 km/h, which is particularly relevant for city driving. For interior noise at low speeds, the Falken was rated the quietest, while the Vredestein and Firestone scored lowest subjectively.
- Dunlop Blue Response TG
- Continental EcoContact 6
- Michelin Primacy 5
- Vredestein Ultrac plus
- Giti GitiSynergyH2
- Falken e.Ziex
- Firestone Roadhawk 2 ENLITEN
- Cooper Summer
Value
Lab-measured rolling resistance ranged from 5.8 kg/t for the Continental to 8.4 kg/t for the Dunlop - a 45% difference. The Giti, despite carrying an A label for rolling resistance, measured 6.6 kg/t and was beaten by the Continental. This test highlights the fundamental engineering trade-off: the three tires with the lowest rolling resistance (Continental, Giti, Falken) all had the weakest wet braking performance.
- Continental EcoContact 6
- Giti GitiSynergyH2
- Falken e.Ziex
- Michelin Primacy 5
- Cooper Summer
- Firestone Roadhawk 2 ENLITEN
- Vredestein Ultrac plus
- Dunlop Blue Response TG
Real-world energy consumption was measured on the Hyundai Inster over a 10 km urban circuit kept below 60 km/h to isolate tire effects from aerodynamic drag. The Continental used 9.9 kWh/100km while the Dunlop used 11.1 kWh/100km - a difference of over 10%, translating to 39 km of extra range for the Continental. The results correlated closely with the lab rolling resistance figures.
- Continental EcoContact 6
- Giti GitiSynergyH2
- Falken e.Ziex
- Michelin Primacy 5
- Cooper Summer
- Vredestein Ultrac plus
- Firestone Roadhawk 2 ENLITEN
- Dunlop Blue Response TG
Results
The Dunlop Blue Response TG took a clear win with the only "outstanding" rating, dominating wet and dry grip but finishing last for efficiency. The Vredestein Ultrac+ and Michelin Primacy 5 followed in second and third. The Giti Synergy H2 finished last overall, its A/A/A EU label not reflected in the measured results.
The Dunlop Blue Response TG wins this test outright with top scores across nearly every category. It delivers the shortest braking distances on both wet and dry surfaces, the highest lateral grip on wet roads, and the fastest lap times in wet and dry handling. Test drivers rated it as precise, responsive to steering inputs, and stable during lane changes, with a wide and predictable limit range. Under hard cornering at the limit, it tends toward understeer but can become slightly unsettled by lift-off oversteer. The trade-off is clear: it has the highest rolling resistance and energy consumption in the test, resulting in the shortest range on the electric test car. Interior noise levels are well controlled. This is a newly developed tire from Sumitomo/Falken following their full acquisition of the Dunlop brand, manufactured in Turkey. Retail-purchased tires matched the test samples in follow-up checks.
| Test |
# |
% |
| Dry Braking |
1st |
100% |
| Dry Handling |
1st |
100% |
| Test |
# |
% |
| Wet Braking |
2nd |
97.26% |
| Wet Handling |
1st |
100% |
| Wet Circle |
1st |
100% |
| Straight Aqua |
1st |
100% |
| Curved Aquaplaning |
4th |
89.54% |
| Test |
# |
% |
| Rolling Resistance |
8th |
69.05% |
| Energy Consumption |
8th |
89.19% |
The Vredestein Ultrac+ is a recently revised tire that finishes second overall, driven mainly by strong wet performance. It posts the shortest wet braking distance of all tires tested and performs well in wet handling and aquaplaning resistance. On dry roads, however, test drivers found it less impressive - cornering behavior is safe but lacks precision, with sluggish initial turn-in response. Steering feel is described as vague on dry asphalt. A faint slip-angle noise is audible during cornering. Rolling resistance is on the higher side, placing it sixth out of eight. It was also subject to follow-up verification testing with retail-purchased tires, which confirmed the original results.
| Test |
# |
% |
| Dry Braking |
3rd |
96.14% |
| Dry Handling |
8th |
99.07% |
| Test |
# |
% |
| Wet Braking |
1st |
100% |
| Wet Handling |
3rd |
98.57% |
| Wet Circle |
2nd |
97.73% |
| Straight Aqua |
3rd |
99.13% |
| Curved Aquaplaning |
5th |
82.85% |
| Test |
# |
% |
| Noise |
4th |
98.99% |
| Test |
# |
% |
| Rolling Resistance |
6th |
69.88% |
| Energy Consumption |
6th |
90.83% |
The Michelin Primacy 5 delivers balanced and safe handling on both wet and dry surfaces, with enough cornering reserve to remain controllable at the limit. Test drivers noted good aquaplaning protection. On dry roads, however, braking distances are longer than average, and the tire felt somewhat unstable during fast lane-change maneuvers. Ride comfort is a weak point due to low self-damping, making it feel firm over bumps. It sits in the middle of the field for rolling resistance and is the most expensive tire in the test at 135 euros. Overall, it offers predictable, secure behavior without standout performance in any single area.
| Test |
# |
% |
| Dry Braking |
7th |
94.07% |
| Dry Handling |
6th |
99.16% |
| Test |
# |
% |
| Wet Braking |
4th |
91.49% |
| Wet Handling |
4th |
98.03% |
| Wet Circle |
7th |
96.09% |
| Straight Aqua |
2nd |
99.89% |
| Curved Aquaplaning |
2nd |
92.26% |
| Test |
# |
% |
| Noise |
3rd |
99.57% |
| Test |
# |
% |
| Rolling Resistance |
4th |
80.56% |
| Energy Consumption |
4th |
95.19% |
The Falken e.Ziex is specifically designed for electric vehicles, prioritizing low rolling resistance and quiet running. It is the quietest tire in the test at low speeds inside the cabin, and it delivers comfortable ride quality. On dry roads, it behaves in a safe, understeer-biased manner with good cornering reserves, though steering response is somewhat lazy. The main weakness shows on wet roads: braking distances are longer than average, and the tire exhibits unstable, lift-off-sensitive behavior in wet corners. Rolling resistance and efficiency are strong, making it the top recommendation for EV owners focused on range. It carries a B/A/B EU label, deliberately trading some rolling resistance performance for better wet grip compared to the most aggressive efficiency tires.
| Test |
# |
% |
| Dry Braking |
2nd |
98.31% |
| Dry Handling |
4th |
99.72% |
| Test |
# |
% |
| Wet Braking |
5th |
85.75% |
| Wet Handling |
5th |
96.95% |
| Wet Circle |
3rd |
97.6% |
| Straight Aqua |
6th |
95.88% |
| Curved Aquaplaning |
6th |
80.96% |
| Test |
# |
% |
| Noise |
6th |
98.14% |
| Test |
# |
% |
| Rolling Resistance |
3rd |
84.06% |
| Energy Consumption |
3rd |
97.06% |
The Firestone Roadhawk 2 performs well on wet surfaces, with strong results in wet handling, aquaplaning resistance, and the best lateral aquaplaning score in the test. Dry road behavior offers good cornering stability. Steering response is somewhat delayed, and test drivers noted minor comfort shortcomings. Its biggest drawback is efficiency - rolling resistance is among the highest in the group, tied with Vredestein, leading to high energy consumption and reduced range. The exterior pass-by noise measurement is also the second loudest. It is the cheapest tire in the test after Cooper, priced at 106 euros.
| Test |
# |
% |
| Dry Braking |
6th |
95.36% |
| Dry Handling |
5th |
99.26% |
| Test |
# |
% |
| Wet Braking |
3rd |
92.21% |
| Wet Handling |
2nd |
98.75% |
| Wet Circle |
4th |
97.22% |
| Straight Aqua |
5th |
97.18% |
| Curved Aquaplaning |
1st |
100% |
| Test |
# |
% |
| Noise |
7th |
96.08% |
| Test |
# |
% |
| Rolling Resistance |
6th |
69.88% |
| Energy Consumption |
7th |
90% |
The Continental EcoContact 6 is the efficiency leader, recording the lowest rolling resistance by a significant margin and delivering the longest range on the electric test car. Interior noise is very quiet. On dry roads, it handles securely with stable cornering behavior and precise steering - test drivers gave it the highest score for steering response. The cost of this efficiency focus is severe: wet braking distances are the longest in the test, wet lateral grip is the weakest, and wet handling times are the slowest. The gap is substantial - it slides 6.4 meters further than the Dunlop when braking on wet surfaces. Its EU label reflects this trade-off with an A rating for rolling resistance but only B for wet grip, the only tire in the group not rated A for wet grip. Dry braking is also on the longer side.
| Test |
# |
% |
| Dry Braking |
3rd |
96.14% |
| Dry Handling |
2nd |
99.81% |
| Test |
# |
% |
| Wet Braking |
7th |
82.75% |
| Wet Handling |
8th |
93.91% |
| Wet Circle |
8th |
95.83% |
| Straight Aqua |
8th |
88.72% |
| Curved Aquaplaning |
8th |
66.95% |
| Test |
# |
% |
| Noise |
2nd |
99.71% |
| Test |
# |
% |
| Rolling Resistance |
1st |
100% |
| Energy Consumption |
1st |
100% |
The Cooper Summer is a new product following Cooper's acquisition by Goodyear. On wet roads, it delivers secure, precise, and reliable handling with very good aquaplaning protection, and test drivers found it easy to control. The problem area is dry braking, where it records the longest stopping distance in the test at 37.5 meters - a borderline result. A slight rubbing sensation was noted at the handling limit, and a faint rolling noise is audible in corners. Rolling resistance is mid-pack, and it is among the cheaper options at 100 euros. Like Dunlop and Vredestein, retail-purchased samples were verified in follow-up tests and confirmed the original results.
| Test |
# |
% |
| Dry Braking |
8th |
93.07% |
| Dry Handling |
6th |
99.16% |
| Test |
# |
% |
| Wet Braking |
6th |
85.54% |
| Wet Handling |
5th |
96.95% |
| Wet Circle |
5th |
96.97% |
| Straight Aqua |
4th |
98.37% |
| Curved Aquaplaning |
3rd |
91.84% |
| Test |
# |
% |
| Noise |
8th |
95.55% |
| Test |
# |
% |
| Rolling Resistance |
5th |
75.32% |
| Energy Consumption |
5th |
94.29% |
The Giti Synergy H2 carries an ambitious A/A/A EU label - the best possible ratings for rolling resistance, wet grip, and noise - but the test results do not support those claims. Wet braking is the worst in the field at 43.8 meters, and wet grip scores are consistently near the bottom. On dry roads, it is sluggish and imprecise but still safe and manageable, with reasonably comfortable ride quality. Rolling resistance lab results place it second behind Continental, which is decent but not the class-leading performance the A label implies. The article concludes that the gap between label and actual performance is more about optimistic self-labeling than poor engineering. Manufactured in China, it finishes last in the overall ranking.
| Test |
# |
% |
| Dry Braking |
5th |
95.88% |
| Dry Handling |
2nd |
99.81% |
| Test |
# |
% |
| Wet Braking |
8th |
81.05% |
| Wet Handling |
7th |
94.98% |
| Wet Circle |
6th |
96.34% |
| Straight Aqua |
7th |
91.11% |
| Curved Aquaplaning |
7th |
74.48% |
| Test |
# |
% |
| Noise |
5th |
98.85% |
| Test |
# |
% |
| Rolling Resistance |
2nd |
87.88% |
| Energy Consumption |
2nd |
98.02% |

Discussion