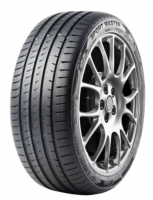
Test Charts / Auto Bild
2025 Summer Tire Test Shootout
Compare each discipline in the tested size. See the measured result, position and gap to the best tire, then read the verdict for the trade-offs behind the finishing order.
- Tested size
- 225/40 R18
- Tires tested
- 52
- Disciplines
- 2

Read the measurements, not just the rank
Lower is better for braking distances and lap times; higher is better for subjective scores and aquaplaning speed. Bars start at zero. Read the gap alongside the position: adjacent tires can be separated by very different margins.
Positions and gaps always refer to the full test field within each group. Selecting tires does not recalculate rankings or change the best-in-test benchmark.
Focus on your tires
Select tires to highlight them throughout the charts.
Positions and gaps always refer to the full test field within each group. Selecting tires does not recalculate rankings or change the best-in-test benchmark.
Dry
1Dry Braking
Dry braking in feet (62 - 0 mph)
Lower is better ↓| Position / Tire | Result | Gap to best | Residual speed |
|---|---|---|---|
| 107 ft | Best | 0 mph | |
| 108 ft | +1 ft | 9 mph | |
| 110 ft | +3 ft | 13 mph | |
| 111 ft | +4 ft | 15 mph | |
| 111 ft | +4 ft | 16 mph | |
| 112 ft | +5 ft | 16 mph | |
| 112 ft | +5 ft | 16 mph | |
| 112 ft | +5 ft | 17 mph | |
| 112 ft | +5 ft | 17 mph | |
| 112 ft | +5 ft | 17 mph | |
| 113 ft | +6 ft | 18 mph | |
| 114 ft | +7 ft | 19 mph | |
| 114 ft | +7 ft | 19 mph | |
| 114 ft | +7 ft | 19 mph | |
| 114 ft | +7 ft | 20 mph | |
| 115 ft | +8 ft | 21 mph | |
| 115 ft | +8 ft | 21 mph | |
| 115 ft | +8 ft | 21 mph | |
| 115 ft | +8 ft | 22 mph | |
| 116 ft | +9 ft | 22 mph | |
| 116 ft | +9 ft | 22 mph | |
| 117 ft | +10 ft | 24 mph | |
| 118 ft | +11 ft | 24 mph | |
| 118 ft | +11 ft | 25 mph | |
| 119 ft | +12 ft | 25 mph | |
| 119 ft | +12 ft | 25 mph | |
| 119 ft | +12 ft | 26 mph | |
| 120 ft | +13 ft | 26 mph | |
| 120 ft | +13 ft | 26 mph | |
| 121 ft | +14 ft | 27 mph | |
| 121 ft | +14 ft | 27 mph | |
| 121 ft | +14 ft | 27 mph | |
| 122 ft | +15 ft | 28 mph | |
| 122 ft | +15 ft | 28 mph | |
| 123 ft | +16 ft | 29 mph | |
| 123 ft | +16 ft | 29 mph | |
| 123 ft | +16 ft | 29 mph | |
| 123 ft | +16 ft | 29 mph | |
| 123 ft | +16 ft | 29 mph | |
| 123 ft | +16 ft | 29 mph | |
| 123 ft | +16 ft | 29 mph | |
| 123 ft | +16 ft | 29 mph | |
| 123 ft | +16 ft | 29 mph | |
| 124 ft | +17 ft | 29 mph | |
| 124 ft | +17 ft | 30 mph | |
| 124 ft | +17 ft | 30 mph | |
| 124 ft | +17 ft | 30 mph | |
| 125 ft | +18 ft | 30 mph | |
| 126 ft | +19 ft | 31 mph | |
| 126 ft | +19 ft | 31 mph | |
| 127 ft | +20 ft | 32 mph | |
| 128 ft | +21 ft | 32 mph |
The difference between best and worst was 19.3% (21 ft ≈ 1.4 Car Lengths). From 80 mph, the Tourador X Speed TU1 would still be travelling at 32 mph when the Bridgestone Potenza Sport had stopped.
Residual speed is calculated from the measured braking distances, assuming constant deceleration; it is not a separate measurement.

Wet
1Wet Braking
Wet braking in feet (50 - 0 mph)
Lower is better ↓| Position / Tire | Result | Gap to best | Residual speed |
|---|---|---|---|
| 90 ft | Best | 0 mph | |
| 90 ft | Best | 0 mph | |
| 90 ft | Best | 0 mph | |
| 91 ft | +1 ft | 7 mph | |
| 91 ft | +1 ft | 8 mph | |
| 93 ft | +3 ft | 14 mph | |
| 93 ft | +3 ft | 14 mph | |
| 94 ft | +4 ft | 17 mph | |
| 96 ft | +6 ft | 20 mph | |
| 97 ft | +7 ft | 21 mph | |
| 97 ft | +7 ft | 22 mph | |
| 99 ft | +9 ft | 25 mph | |
| 100 ft | +10 ft | 25 mph | |
| 100 ft | +10 ft | 25 mph | |
| 101 ft | +11 ft | 27 mph | |
| 101 ft | +11 ft | 27 mph | |
| 102 ft | +12 ft | 28 mph | |
| 102 ft | +12 ft | 28 mph | |
| 102 ft | +12 ft | 28 mph | |
| 103 ft | +13 ft | 29 mph | |
| 104 ft | +14 ft | 29 mph | |
| 104 ft | +14 ft | 29 mph | |
| 104 ft | +14 ft | 30 mph | |
| 105 ft | +15 ft | 30 mph | |
| 105 ft | +15 ft | 30 mph | |
| 106 ft | +16 ft | 31 mph | |
| 108 ft | +18 ft | 33 mph | |
| 109 ft | +19 ft | 33 mph | |
| 109 ft | +19 ft | 33 mph | |
| 110 ft | +20 ft | 34 mph | |
| 111 ft | +21 ft | 35 mph | |
| 111 ft | +21 ft | 35 mph | |
| 111 ft | +21 ft | 35 mph | |
| 112 ft | +22 ft | 35 mph | |
| 112 ft | +22 ft | 35 mph | |
| 112 ft | +22 ft | 36 mph | |
| 113 ft | +23 ft | 36 mph | |
| 114 ft | +24 ft | 37 mph | |
| 115 ft | +25 ft | 37 mph | |
| 115 ft | +25 ft | 37 mph | |
| 115 ft | +25 ft | 38 mph | |
| 119 ft | +29 ft | 39 mph | |
| 120 ft | +30 ft | 40 mph | |
| 120 ft | +30 ft | 40 mph | |
| 122 ft | +32 ft | 41 mph | |
| 123 ft | +33 ft | 42 mph | |
| 123 ft | +33 ft | 42 mph | |
| 125 ft | +35 ft | 42 mph | |
| 125 ft | +35 ft | 42 mph | |
| 126 ft | +36 ft | 43 mph | |
| 127 ft | +37 ft | 43 mph | |
| 143 ft | +53 ft | 49 mph |
The difference between best and worst was 59.1% (53 ft ≈ 3.6 Car Lengths). From 80 mph, the Autogreen Smart Chaser SC1 would still be travelling at 49 mph when the Linglong Sport Master had stopped.
Residual speed is calculated from the measured braking distances, assuming constant deceleration; it is not a separate measurement.
Test setup & methodology
The test setting, the conditions recorded and how the results contribute to the score.
Recorded test conditions
Recorded test conditions
- Dry Braking
- 62.1 → 0.0 mph
- Wet Braking
- 49.7 → 0.0 mph
More tire tests
Cross-check this test
Where these tires were tested again, and how the verdict held up.
2023 Summer Tire Market Overview
225/45 R1848 tires tested
21 of these 52 tires tested again
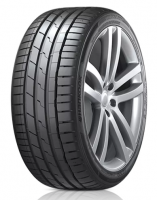
2025 Auto Bild Summer Performance Tire Test
225/40 R1820 tires tested
20 of these 52 tires tested again
Goodyear Eagle F1 Asymmetric 6 / Michelin Pilot Sport 5
This test’s winner finished 3rd there2026 Summer Braking Super Tire Test - How do 52 Tires Perform in Wet and Dry Braking?
245/45 R1950 tires tested
18 of these 52 tires tested again