



Below is the data from the excellent 2024 ADAC summer tire test, which tested sixteen tires in the popular 215/55 R17 size.
Test setup & methodology
The test setting, the conditions recorded and how the results contribute to the score.
Recorded test conditions
Recorded test conditions
- Dry Braking
- 62.1 → 0.0 mph
- Wet Braking
- 49.7 → 0.0 mph
- Wet Braking - Concrete
- 49.7 → 0.0 mph
ADAC do not share all the data they use to read their final order, but they do share some very interesting test results, including wear! We've added a value calculation to the results comparing the reported purchase price against projected total mileage.
Dry
The new Continental PremiumContact 7 had a good advantage in dry braking over the second placed Michelin, which drew with the Linglong Sport Master.
Dry Braking
Dry braking in feet (62 - 0 mph)
Lower is better ↓| Position / Tire | Result | Gap to best | Residual speed |
|---|---|---|---|
| 116 ft | Best | 0 mph | |
| 122 ft | +6 ft | 18 mph | |
| 122 ft | +6 ft | 18 mph | |
| 123 ft | +7 ft | 19 mph | |
| 124 ft | +8 ft | 20 mph | |
| 124 ft | +8 ft | 20 mph | |
| 124 ft | +8 ft | 20 mph | |
| 124 ft | +8 ft | 20 mph | |
| 124 ft | +8 ft | 21 mph | |
| 124 ft | +8 ft | 21 mph | |
| 125 ft | +9 ft | 21 mph | |
| 125 ft | +9 ft | 21 mph | |
| 125 ft | +9 ft | 21 mph | |
| 126 ft | +10 ft | 22 mph | |
| 128 ft | +12 ft | 24 mph | |
| 134 ft | +18 ft | 29 mph |
The difference between best and worst was 15.5% (18 ft ≈ 1.2 Car Lengths). From 80 mph, the Semperit Speed Life 3 would still be travelling at 29 mph when the Continental PremiumContact 7 had stopped.
Residual speed is calculated from the measured braking distances, assuming constant deceleration; it is not a separate measurement.
Wet
The Continental also aced the wet braking test on both tarmac and concrete.
Wet Braking
Wet braking in feet (50 - 0 mph)
Lower is better ↓| Position / Tire | Result | Gap to best | Residual speed |
|---|---|---|---|
| 94 ft | Best | 0 mph | |
| 102 ft | +8 ft | 23 mph | |
| 107 ft | +13 ft | 28 mph | |
| 107 ft | +13 ft | 29 mph | |
| 108 ft | +14 ft | 29 mph | |
| 108 ft | +14 ft | 29 mph | |
| 108 ft | +14 ft | 30 mph | |
| 109 ft | +15 ft | 30 mph | |
| 109 ft | +15 ft | 30 mph | |
| 110 ft | +16 ft | 31 mph | |
| 112 ft | +18 ft | 32 mph | |
| 113 ft | +19 ft | 33 mph | |
| 114 ft | +20 ft | 34 mph | |
| 114 ft | +20 ft | 34 mph | |
| 115 ft | +21 ft | 34 mph | |
| 115 ft | +21 ft | 35 mph |
The difference between best and worst was 23.2% (21 ft ≈ 1.5 Car Lengths). From 80 mph, the Goodride Solmax 1 would still be travelling at 35 mph when the Continental PremiumContact 7 had stopped.
Residual speed is calculated from the measured braking distances, assuming constant deceleration; it is not a separate measurement.
Wet Braking - Concrete
Wet braking on Concrete in feet (50 - 0 mph)
Lower is better ↓| Position / Tire | Result | Gap to best | Residual speed |
|---|---|---|---|
| 105 ft | Best | 0 mph | |
| 117 ft | +12 ft | 26 mph | |
| 119 ft | +14 ft | 28 mph | |
| 119 ft | +14 ft | 28 mph | |
| 122 ft | +17 ft | 30 mph | |
| 122 ft | +17 ft | 30 mph | |
| 122 ft | +17 ft | 30 mph | |
| 123 ft | +18 ft | 30 mph | |
| 125 ft | +20 ft | 32 mph | |
| 126 ft | +21 ft | 32 mph | |
| 126 ft | +21 ft | 32 mph | |
| 128 ft | +23 ft | 34 mph | |
| 130 ft | +25 ft | 35 mph | |
| 131 ft | +26 ft | 36 mph | |
| 131 ft | +26 ft | 36 mph | |
| 132 ft | +27 ft | 36 mph |
The difference between best and worst was 25.3% (27 ft ≈ 1.8 Car Lengths). From 80 mph, the Goodride Solmax 1 would still be travelling at 36 mph when the Continental PremiumContact 7 had stopped.
Residual speed is calculated from the measured braking distances, assuming constant deceleration; it is not a separate measurement.
On average the Vredestein Ultrac was best in the deeper water of aquaplaning tests.
Straight Aqua
Float Speed in mph
Higher is better ↑| Position / Tire | Result | Gap to best |
|---|---|---|
| 48.8 mph | Best | |
| 48.7 mph | -0.1 mph | |
| 48.3 mph | -0.5 mph | |
| 48.3 mph | -0.5 mph | |
| 48.1 mph | -0.7 mph | |
| 48.0 mph | -0.8 mph | |
| 47.7 mph | -1.1 mph | |
| 47.7 mph | -1.1 mph | |
| 47.5 mph | -1.3 mph | |
| 46.8 mph | -2.0 mph | |
| 46.7 mph | -2.1 mph | |
| 46.5 mph | -2.3 mph | |
| 46.2 mph | -2.6 mph | |
| 46.1 mph | -2.7 mph | |
| 46.0 mph | -2.8 mph | |
| 45.9 mph | -2.9 mph |
The difference between best and worst was 6% (2.9 mph).
Curved Aquaplaning
Remaining lateral acceleration
Higher is better ↑| Position / Tire | Result | Gap to best |
|---|---|---|
| 11.5 ft/s² | Best | |
| 11.5 ft/s² | Best | |
| 10.8 ft/s² | -0.7 ft/s² | |
| 10.8 ft/s² | -0.7 ft/s² | |
| 10.8 ft/s² | -0.7 ft/s² | |
| 10.8 ft/s² | -0.7 ft/s² | |
| 10.5 ft/s² | -1.0 ft/s² | |
| 10.5 ft/s² | -1.0 ft/s² | |
| 10.2 ft/s² | -1.3 ft/s² | |
| 10.2 ft/s² | -1.3 ft/s² | |
| 10.2 ft/s² | -1.3 ft/s² | |
| 9.8 ft/s² | -1.7 ft/s² | |
| 9.5 ft/s² | -2.0 ft/s² | |
| 9.2 ft/s² | -2.3 ft/s² | |
| 9.2 ft/s² | -2.3 ft/s² | |
| 8.9 ft/s² | -2.6 ft/s² |
The difference between best and worst was 22.9% (2.6 ft/s²).
Comfort
The cheaper tires performed very well in the external noise tests with Sailun and Linglong leading the way.
Noise
External noise in dB
Lower is better ↓| Position / Tire | Result | Gap to best |
|---|---|---|
| 70 dB | Best | |
| 70.6 dB | +0.60 dB | |
| 70.7 dB | +0.70 dB | |
| 71 dB | +1.00 dB | |
| 71.3 dB | +1.30 dB | |
| 71.4 dB | +1.40 dB | |
| 71.4 dB | +1.40 dB | |
| 71.5 dB | +1.50 dB | |
| 71.6 dB | +1.60 dB | |
| 71.6 dB | +1.60 dB | |
| 71.7 dB | +1.70 dB | |
| 71.7 dB | +1.70 dB | |
| 71.7 dB | +1.70 dB | |
| 71.8 dB | +1.80 dB | |
| 71.8 dB | +1.80 dB | |
| 72.6 dB | +2.60 dB |
The difference between best and worst was 3.7% (2.6 dB).

Value
Kumho narrowly beat Goodyear to be the best wearing tires on test, and the quick stopping Continental matched the Michelin for third place.
Wear
Predicted tread life in KM
Higher is better ↑| Position / Tire | Result | Gap to best | cost per 1,000 miles |
|---|---|---|---|
| 43,061 miles | Best | $8.23 | |
| 42,750 miles | -311 miles | $10.88 | |
| 37,469 miles | -5,592 miles | $13.41 | |
| 37,469 miles | -5,592 miles | $12.89 | |
| 34,300 miles | -8,761 miles | $11.53 | |
| 31,006 miles | -12,055 miles | $12.69 | |
| 29,764 miles | -13,297 miles | $15.79 | |
| 28,769 miles | -14,292 miles | $13.13 | |
| 27,154 miles | -15,907 miles | $16.11 | |
| 26,533 miles | -16,528 miles | $13.11 | |
| 25,352 miles | -17,709 miles | $14.40 | |
| 25,103 miles | -17,958 miles | $15.66 | |
| 23,612 miles | -19,449 miles | $13.39 | |
| 23,239 miles | -19,822 miles | $12.30 | |
| 22,121 miles | -20,940 miles | $15.73 | |
| 16,901 miles | -26,160 miles | $23.38 |
The difference between best and worst was 60.8% (26,160 miles). Over 25,000 miles the cheapest tire to own (Kumho Ecsta HS52) works out $379 cheaper than the most expensive (Vredestein Ultrac).
How this is calculated
Tire life here is the manufacturer's treadwear warranty, NOT measured wear - treat it as the maker's promise, not a test result.
Tire life is the manufacturer's treadwear warranty, not measured wear. Assumes $80 fitting per set of four. US prices are from the time of the 2024 test; financing costs are excluded.
The low wear of the Kumho paired with its reasonable purchase price it proved to be the cheapest per 1000km driven.
Value
Dollars/1000 miles based on mileage warranty
Lower is better ↓| Position / Tire | Result | Gap to best |
|---|---|---|
| 1.77 Price/1000 | Best | |
| 2.43 Price/1000 | +0.66 Price/1000 | |
| 2.52 Price/1000 | +0.75 Price/1000 | |
| 2.54 Price/1000 | +0.77 Price/1000 | |
| 2.77 Price/1000 | +1.00 Price/1000 | |
| 2.81 Price/1000 | +1.04 Price/1000 | |
| 2.82 Price/1000 | +1.05 Price/1000 | |
| 2.85 Price/1000 | +1.08 Price/1000 | |
| 2.89 Price/1000 | +1.12 Price/1000 | |
| 3.02 Price/1000 | +1.25 Price/1000 | |
| 3.11 Price/1000 | +1.34 Price/1000 | |
| 3.37 Price/1000 | +1.60 Price/1000 | |
| 3.42 Price/1000 | +1.65 Price/1000 | |
| 3.53 Price/1000 | +1.76 Price/1000 | |
| 3.57 Price/1000 | +1.80 Price/1000 | |
| 5.11 Price/1000 | +3.34 Price/1000 |
The difference between best and worst was 188.7% (3.34 Price/1000).
ADAC test fuel consumption by driving, not on a machine. The results were very close with three tires tying for top spot.
Fuel Consumption
Fuel consumption in Liters per 100 km
Lower is better ↓| Position / Tire | Result | Gap to best | Extra fuel / year |
|---|---|---|---|
| 5.7 l/100km | Best | $0 | |
| 5.7 l/100km | Best | $0 | |
| 5.7 l/100km | Best | $0 | |
| 5.8 l/100km | +0.10 l/100km | $18 | |
| 5.8 l/100km | +0.10 l/100km | $18 | |
| 5.8 l/100km | +0.10 l/100km | $18 | |
| 5.9 l/100km | +0.20 l/100km | $37 | |
| 5.9 l/100km | +0.20 l/100km | $37 | |
| 5.9 l/100km | +0.20 l/100km | $37 | |
| 5.9 l/100km | +0.20 l/100km | $37 | |
| 5.9 l/100km | +0.20 l/100km | $37 | |
| 5.9 l/100km | +0.20 l/100km | $37 | |
| 5.9 l/100km | +0.20 l/100km | $37 | |
| 5.9 l/100km | +0.20 l/100km | $37 | |
| 5.9 l/100km | +0.20 l/100km | $37 | |
| 6 l/100km | +0.30 l/100km | $55 |
The difference between best and worst was 5.3% (0.3 l/100km). Over 12,000 miles a year at $3.60/gal, the Falken ZIEX ZE310 EcoRun uses about 15 gal ($55) more fuel than the Hankook Ventus Prime 4.
Adjust the assumptions
Calculated estimates, not additional measurements. Use the controls to explore the assumptions.
As usual, Michelin had the lowest wearing compound which means it produced the lowest amount of environmental pollution.
Abrasion
Weight of Tire Wear Particles Lost (mg/km/t)
Lower is better ↓| Position / Tire | Result | Gap to best |
|---|---|---|
| 48.1 mg/km/t | Best | |
| 51.9 mg/km/t | +3.80 mg/km/t | |
| 55 mg/km/t | +6.90 mg/km/t | |
| 58.7 mg/km/t | +10.60 mg/km/t | |
| 60.1 mg/km/t | +12.00 mg/km/t | |
| 67.4 mg/km/t | +19.30 mg/km/t | |
| 70.4 mg/km/t | +22.30 mg/km/t | |
| 72 mg/km/t | +23.90 mg/km/t | |
| 73 mg/km/t | +24.90 mg/km/t | |
| 73.5 mg/km/t | +25.40 mg/km/t | |
| 79.8 mg/km/t | +31.70 mg/km/t | |
| 80.8 mg/km/t | +32.70 mg/km/t | |
| 81.2 mg/km/t | +33.10 mg/km/t | |
| 82.5 mg/km/t | +34.40 mg/km/t | |
| 87.3 mg/km/t | +39.20 mg/km/t | |
| 102.7 mg/km/t | +54.60 mg/km/t |
The difference between best and worst was 113.5% (54.6 mg/km/t).
Results
Continental PremiumContact 7
215/55 R17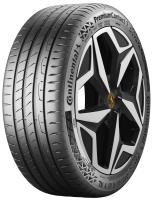
Category scores (% of best)
All discipline results (10)
Discipline positions compare the ranked tires in this test, not the whole market. These are individual measurements, not weighted overall scores.
| Test | Position in discipline | Result | Gap to best |
|---|---|---|---|
| Dry BrakingLower is better | 1st / 16 | 116 ft | Best in this discipline |
| Wet BrakingLower is better | 1st / 16 | 94 ft | Best in this discipline |
| Wet Braking - ConcreteLower is better | 1st / 16 | 105 ft | Best in this discipline |
| Straight AquaHigher is better | 15th / 16 | 46.0 mph | -2.8 mph |
| Curved AquaplaningHigher is better | 14th / 16 | 9.2 ft/s² | -2.3 ft/s² |
| NoiseLower is better | 5th / 16 | 71.3 dB | +1.30 dB |
| WearHigher is better | 3rd / 16 | 37,469 miles | -5,592 miles |
| ValueLower is better | 9th / 16 | 2.89 Price/1000 | +1.12 Price/1000 |
| Fuel ConsumptionLower is better | 7th / 16 | 5.9 l/100km | +0.20 l/100km |
| AbrasionLower is better | 5th / 16 | 60.1 mg/km/t | +12.00 mg/km/t |
- EU Label
- C/A/71
- Price
- 174.00
Michelin Primacy 4+
215/55 R17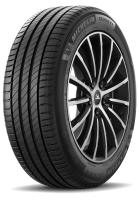
Category scores (% of best)
All discipline results (10)
Discipline positions compare the ranked tires in this test, not the whole market. These are individual measurements, not weighted overall scores.
| Test | Position in discipline | Result | Gap to best |
|---|---|---|---|
| Dry BrakingLower is better | 2nd / 16 | 122 ft | +6 ft |
| Wet BrakingLower is better | 2nd / 16 | 102 ft | +8 ft |
| Wet Braking - ConcreteLower is better | 5th / 16 | 122 ft | +17 ft |
| Straight AquaHigher is better | 10th / 16 | 46.8 mph | -2.0 mph |
| Curved AquaplaningHigher is better | 13th / 16 | 9.5 ft/s² | -2.0 ft/s² |
| NoiseLower is better | 3rd / 16 | 70.7 dB | +0.70 dB |
| WearHigher is better | 3rd / 16 | 37,469 miles | -5,592 miles |
| ValueLower is better | 10th / 16 | 3.02 Price/1000 | +1.25 Price/1000 |
| Fuel ConsumptionLower is better | 4th / 16 | 5.8 l/100km | +0.10 l/100km |
| AbrasionLower is better | 1st / 16 | 48.1 mg/km/t | Best in this discipline |
- EU Label
- B/A/70
- Price
- 182.00
Kumho Ecsta HS52
215/55 R17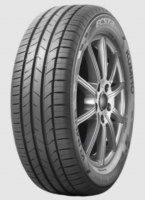
Category scores (% of best)
All discipline results (10)
Discipline positions compare the ranked tires in this test, not the whole market. These are individual measurements, not weighted overall scores.
| Test | Position in discipline | Result | Gap to best |
|---|---|---|---|
| Dry BrakingLower is better | 12th / 16 | 125 ft | +9 ft |
| Wet BrakingLower is better | 5th / 16 | 108 ft | +14 ft |
| Wet Braking - ConcreteLower is better | 2nd / 16 | 117 ft | +12 ft |
| Straight AquaHigher is better | 16th / 16 | 45.9 mph | -2.9 mph |
| Curved AquaplaningHigher is better | 12th / 16 | 9.8 ft/s² | -1.7 ft/s² |
| NoiseLower is better | 16th / 16 | 72.6 dB | +2.60 dB |
| WearHigher is better | 1st / 16 | 43,061 miles | Best in this discipline |
| ValueLower is better | 1st / 16 | 1.77 Price/1000 | Best in this discipline |
| Fuel ConsumptionLower is better | 7th / 16 | 5.9 l/100km | +0.20 l/100km |
| AbrasionLower is better | 3rd / 16 | 55 mg/km/t | +6.90 mg/km/t |
- EU Label
- C/A/72
- Price
- 123.00
Debica Presto UHP2
215/55 R17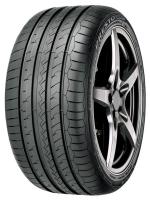
Category scores (% of best)
All discipline results (10)
Discipline positions compare the ranked tires in this test, not the whole market. These are individual measurements, not weighted overall scores.
| Test | Position in discipline | Result | Gap to best |
|---|---|---|---|
| Dry BrakingLower is better | 9th / 16 | 124 ft | +8 ft |
| Wet BrakingLower is better | 13th / 16 | 114 ft | +20 ft |
| Wet Braking - ConcreteLower is better | 8th / 16 | 123 ft | +18 ft |
| Straight AquaHigher is better | 6th / 16 | 48.0 mph | -0.8 mph |
| Curved AquaplaningHigher is better | 3rd / 16 | 10.8 ft/s² | -0.7 ft/s² |
| NoiseLower is better | 9th / 16 | 71.6 dB | +1.60 dB |
| WearHigher is better | 10th / 16 | 26,533 miles | -16,528 miles |
| ValueLower is better | 6th / 16 | 2.81 Price/1000 | +1.04 Price/1000 |
| Fuel ConsumptionLower is better | 7th / 16 | 5.9 l/100km | +0.20 l/100km |
| AbrasionLower is better | 12th / 16 | 80.8 mg/km/t | +32.70 mg/km/t |
- EU Label
- C/A/71
- Price
- 120.00
Dunlop SportMaxx RT 2
215/55 R17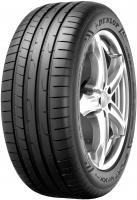
Category scores (% of best)
All discipline results (10)
Discipline positions compare the ranked tires in this test, not the whole market. These are individual measurements, not weighted overall scores.
| Test | Position in discipline | Result | Gap to best |
|---|---|---|---|
| Dry BrakingLower is better | 4th / 16 | 123 ft | +7 ft |
| Wet BrakingLower is better | 12th / 16 | 113 ft | +19 ft |
| Wet Braking - ConcreteLower is better | 9th / 16 | 125 ft | +20 ft |
| Straight AquaHigher is better | 3rd / 16 | 48.3 mph | -0.5 mph |
| Curved AquaplaningHigher is better | 1st / 16 | 11.5 ft/s² | Best in this discipline |
| NoiseLower is better | 14th / 16 | 71.8 dB | +1.80 dB |
| WearHigher is better | 9th / 16 | 27,154 miles | -15,907 miles |
| ValueLower is better | 15th / 16 | 3.57 Price/1000 | +1.80 Price/1000 |
| Fuel ConsumptionLower is better | 7th / 16 | 5.9 l/100km | +0.20 l/100km |
| AbrasionLower is better | 11th / 16 | 79.8 mg/km/t | +31.70 mg/km/t |
- EU Label
- C/A/70
- Price
- 156.00
Bridgestone Turanza 6
215/55 R17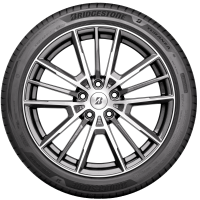
Category scores (% of best)
All discipline results (10)
Discipline positions compare the ranked tires in this test, not the whole market. These are individual measurements, not weighted overall scores.
| Test | Position in discipline | Result | Gap to best |
|---|---|---|---|
| Dry BrakingLower is better | 11th / 16 | 125 ft | +9 ft |
| Wet BrakingLower is better | 13th / 16 | 114 ft | +20 ft |
| Wet Braking - ConcreteLower is better | 14th / 16 | 131 ft | +26 ft |
| Straight AquaHigher is better | 1st / 16 | 48.8 mph | Best in this discipline |
| Curved AquaplaningHigher is better | 7th / 16 | 10.5 ft/s² | -1.0 ft/s² |
| NoiseLower is better | 6th / 16 | 71.4 dB | +1.40 dB |
| WearHigher is better | 7th / 16 | 29,764 miles | -13,297 miles |
| ValueLower is better | 14th / 16 | 3.53 Price/1000 | +1.76 Price/1000 |
| Fuel ConsumptionLower is better | 1st / 16 | 5.7 l/100km | Best in this discipline |
| AbrasionLower is better | 9th / 16 | 73 mg/km/t | +24.90 mg/km/t |
- EU Label
- B/A/70
- Price
- 169.00
Fulda SportControl 2
215/55 R17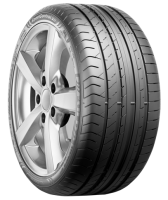
Category scores (% of best)
All discipline results (10)
Discipline positions compare the ranked tires in this test, not the whole market. These are individual measurements, not weighted overall scores.
| Test | Position in discipline | Result | Gap to best |
|---|---|---|---|
| Dry BrakingLower is better | 7th / 16 | 124 ft | +8 ft |
| Wet BrakingLower is better | 15th / 16 | 115 ft | +21 ft |
| Wet Braking - ConcreteLower is better | 10th / 16 | 126 ft | +21 ft |
| Straight AquaHigher is better | 4th / 16 | 48.3 mph | -0.5 mph |
| Curved AquaplaningHigher is better | 3rd / 16 | 10.8 ft/s² | -0.7 ft/s² |
| NoiseLower is better | 11th / 16 | 71.7 dB | +1.70 dB |
| WearHigher is better | 12th / 16 | 25,103 miles | -17,958 miles |
| ValueLower is better | 13th / 16 | 3.42 Price/1000 | +1.65 Price/1000 |
| Fuel ConsumptionLower is better | 7th / 16 | 5.9 l/100km | +0.20 l/100km |
| AbrasionLower is better | 14th / 16 | 82.5 mg/km/t | +34.40 mg/km/t |
- EU Label
- C/A/71
- Price
- 138.00
Hankook Ventus Prime 4
215/55 R17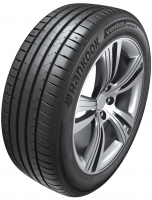
Category scores (% of best)
All discipline results (10)
Discipline positions compare the ranked tires in this test, not the whole market. These are individual measurements, not weighted overall scores.
| Test | Position in discipline | Result | Gap to best |
|---|---|---|---|
| Dry BrakingLower is better | 12th / 16 | 125 ft | +9 ft |
| Wet BrakingLower is better | 5th / 16 | 108 ft | +14 ft |
| Wet Braking - ConcreteLower is better | 12th / 16 | 128 ft | +23 ft |
| Straight AquaHigher is better | 13th / 16 | 46.2 mph | -2.6 mph |
| Curved AquaplaningHigher is better | 16th / 16 | 8.9 ft/s² | -2.6 ft/s² |
| NoiseLower is better | 9th / 16 | 71.6 dB | +1.60 dB |
| WearHigher is better | 6th / 16 | 31,006 miles | -12,055 miles |
| ValueLower is better | 5th / 16 | 2.77 Price/1000 | +1.00 Price/1000 |
| Fuel ConsumptionLower is better | 1st / 16 | 5.7 l/100km | Best in this discipline |
| AbrasionLower is better | 4th / 16 | 58.7 mg/km/t | +10.60 mg/km/t |
- EU Label
- B/A/69
- Price
- 138.00
Goodyear EfficientGrip Performance 2
215/55 R17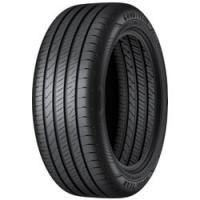
Category scores (% of best)
All discipline results (10)
Discipline positions compare the ranked tires in this test, not the whole market. These are individual measurements, not weighted overall scores.
| Test | Position in discipline | Result | Gap to best |
|---|---|---|---|
| Dry BrakingLower is better | 9th / 16 | 124 ft | +8 ft |
| Wet BrakingLower is better | 9th / 16 | 109 ft | +15 ft |
| Wet Braking - ConcreteLower is better | 10th / 16 | 126 ft | +21 ft |
| Straight AquaHigher is better | 12th / 16 | 46.5 mph | -2.3 mph |
| Curved AquaplaningHigher is better | 9th / 16 | 10.2 ft/s² | -1.3 ft/s² |
| NoiseLower is better | 4th / 16 | 71 dB | +1.00 dB |
| WearHigher is better | 2nd / 16 | 42,750 miles | -311 miles |
| ValueLower is better | 2nd / 16 | 2.43 Price/1000 | +0.66 Price/1000 |
| Fuel ConsumptionLower is better | 4th / 16 | 5.8 l/100km | +0.10 l/100km |
| AbrasionLower is better | 2nd / 16 | 51.9 mg/km/t | +3.80 mg/km/t |
- EU Label
- B/A/70
- Price
- 167.00
Falken ZIEX ZE310 EcoRun
215/55 R17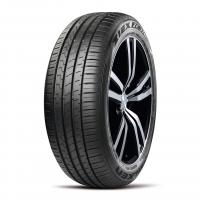
Category scores (% of best)
All discipline results (10)
Discipline positions compare the ranked tires in this test, not the whole market. These are individual measurements, not weighted overall scores.
| Test | Position in discipline | Result | Gap to best |
|---|---|---|---|
| Dry BrakingLower is better | 5th / 16 | 124 ft | +8 ft |
| Wet BrakingLower is better | 3rd / 16 | 107 ft | +13 ft |
| Wet Braking - ConcreteLower is better | 3rd / 16 | 119 ft | +14 ft |
| Straight AquaHigher is better | 5th / 16 | 48.1 mph | -0.7 mph |
| Curved AquaplaningHigher is better | 3rd / 16 | 10.8 ft/s² | -0.7 ft/s² |
| NoiseLower is better | 6th / 16 | 71.4 dB | +1.40 dB |
| WearHigher is better | 8th / 16 | 28,769 miles | -14,292 miles |
| ValueLower is better | 8th / 16 | 2.85 Price/1000 | +1.08 Price/1000 |
| Fuel ConsumptionLower is better | 16th / 16 | 6 l/100km | +0.30 l/100km |
| AbrasionLower is better | 8th / 16 | 72 mg/km/t | +23.90 mg/km/t |
- EU Label
- C/A/69
- Price
- 132.00
Nexen N Fera Primus
215/55 R17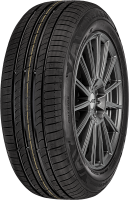
Category scores (% of best)
All discipline results (10)
Discipline positions compare the ranked tires in this test, not the whole market. These are individual measurements, not weighted overall scores.
| Test | Position in discipline | Result | Gap to best |
|---|---|---|---|
| Dry BrakingLower is better | 14th / 16 | 126 ft | +10 ft |
| Wet BrakingLower is better | 7th / 16 | 108 ft | +14 ft |
| Wet Braking - ConcreteLower is better | 6th / 16 | 122 ft | +17 ft |
| Straight AquaHigher is better | 11th / 16 | 46.7 mph | -2.1 mph |
| Curved AquaplaningHigher is better | 7th / 16 | 10.5 ft/s² | -1.0 ft/s² |
| NoiseLower is better | 11th / 16 | 71.7 dB | +1.70 dB |
| WearHigher is better | 11th / 16 | 25,352 miles | -17,709 miles |
| ValueLower is better | 11th / 16 | 3.11 Price/1000 | +1.34 Price/1000 |
| Fuel ConsumptionLower is better | 7th / 16 | 5.9 l/100km | +0.20 l/100km |
| AbrasionLower is better | 10th / 16 | 73.5 mg/km/t | +25.40 mg/km/t |
- EU Label
- B/B/70
- Price
- 127.00
Goodride Solmax 1
215/55 R17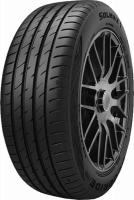
Category scores (% of best)
All discipline results (10)
Discipline positions compare the ranked tires in this test, not the whole market. These are individual measurements, not weighted overall scores.
| Test | Position in discipline | Result | Gap to best |
|---|---|---|---|
| Dry BrakingLower is better | 15th / 16 | 128 ft | +12 ft |
| Wet BrakingLower is better | 16th / 16 | 115 ft | +21 ft |
| Wet Braking - ConcreteLower is better | 16th / 16 | 132 ft | +27 ft |
| Straight AquaHigher is better | 8th / 16 | 47.7 mph | -1.1 mph |
| Curved AquaplaningHigher is better | 3rd / 16 | 10.8 ft/s² | -0.7 ft/s² |
| NoiseLower is better | 8th / 16 | 71.5 dB | +1.50 dB |
| WearHigher is better | 15th / 16 | 22,121 miles | -20,940 miles |
| ValueLower is better | 12th / 16 | 3.37 Price/1000 | +1.60 Price/1000 |
| Fuel ConsumptionLower is better | 7th / 16 | 5.9 l/100km | +0.20 l/100km |
| AbrasionLower is better | 15th / 16 | 87.3 mg/km/t | +39.20 mg/km/t |
- EU Label
- C/A/72
- Price
- 120.00
Sailun Atrezzo ZSR2
215/55 R17
Category scores (% of best)
All discipline results (10)
Discipline positions compare the ranked tires in this test, not the whole market. These are individual measurements, not weighted overall scores.
| Test | Position in discipline | Result | Gap to best |
|---|---|---|---|
| Dry BrakingLower is better | 5th / 16 | 124 ft | +8 ft |
| Wet BrakingLower is better | 4th / 16 | 107 ft | +13 ft |
| Wet Braking - ConcreteLower is better | 15th / 16 | 131 ft | +26 ft |
| Straight AquaHigher is better | 9th / 16 | 47.5 mph | -1.3 mph |
| Curved AquaplaningHigher is better | 9th / 16 | 10.2 ft/s² | -1.3 ft/s² |
| NoiseLower is better | 1st / 16 | 70 dB | Best in this discipline |
| WearHigher is better | 13th / 16 | 23,612 miles | -19,449 miles |
| ValueLower is better | 7th / 16 | 2.82 Price/1000 | +1.05 Price/1000 |
| Fuel ConsumptionLower is better | 1st / 16 | 5.7 l/100km | Best in this discipline |
| AbrasionLower is better | 13th / 16 | 81.2 mg/km/t | +33.10 mg/km/t |
- EU Label
- B/A/69
- Price
- 107.00
Semperit Speed Life 3
215/55 R17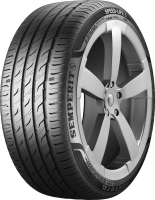
Category scores (% of best)
All discipline results (10)
Discipline positions compare the ranked tires in this test, not the whole market. These are individual measurements, not weighted overall scores.
| Test | Position in discipline | Result | Gap to best |
|---|---|---|---|
| Dry BrakingLower is better | 16th / 16 | 134 ft | +18 ft |
| Wet BrakingLower is better | 10th / 16 | 110 ft | +16 ft |
| Wet Braking - ConcreteLower is better | 13th / 16 | 130 ft | +25 ft |
| Straight AquaHigher is better | 7th / 16 | 47.7 mph | -1.1 mph |
| Curved AquaplaningHigher is better | 9th / 16 | 10.2 ft/s² | -1.3 ft/s² |
| NoiseLower is better | 11th / 16 | 71.7 dB | +1.70 dB |
| WearHigher is better | 5th / 16 | 34,300 miles | -8,761 miles |
| ValueLower is better | 3rd / 16 | 2.52 Price/1000 | +0.75 Price/1000 |
| Fuel ConsumptionLower is better | 4th / 16 | 5.8 l/100km | +0.10 l/100km |
| AbrasionLower is better | 6th / 16 | 67.4 mg/km/t | +19.30 mg/km/t |
- EU Label
- C/B/72
- Price
- 139.00
Linglong Sport Master
215/55 R17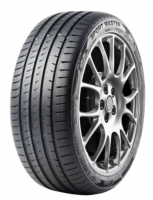
Category scores (% of best)
All discipline results (10)
Discipline positions compare the ranked tires in this test, not the whole market. These are individual measurements, not weighted overall scores.
| Test | Position in discipline | Result | Gap to best |
|---|---|---|---|
| Dry BrakingLower is better | 2nd / 16 | 122 ft | +6 ft |
| Wet BrakingLower is better | 8th / 16 | 109 ft | +15 ft |
| Wet Braking - ConcreteLower is better | 7th / 16 | 122 ft | +17 ft |
| Straight AquaHigher is better | 14th / 16 | 46.1 mph | -2.7 mph |
| Curved AquaplaningHigher is better | 14th / 16 | 9.2 ft/s² | -2.3 ft/s² |
| NoiseLower is better | 2nd / 16 | 70.6 dB | +0.60 dB |
| WearHigher is better | 14th / 16 | 23,239 miles | -19,822 miles |
| ValueLower is better | 4th / 16 | 2.54 Price/1000 | +0.77 Price/1000 |
| Fuel ConsumptionLower is better | 7th / 16 | 5.9 l/100km | +0.20 l/100km |
| AbrasionLower is better | 7th / 16 | 70.4 mg/km/t | +22.30 mg/km/t |
- EU Label
- C/A/69
- Price
- 95.00
Vredestein Ultrac
215/55 R17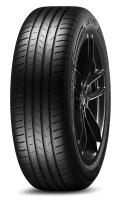
Category scores (% of best)
All discipline results (10)
Discipline positions compare the ranked tires in this test, not the whole market. These are individual measurements, not weighted overall scores.
| Test | Position in discipline | Result | Gap to best |
|---|---|---|---|
| Dry BrakingLower is better | 7th / 16 | 124 ft | +8 ft |
| Wet BrakingLower is better | 11th / 16 | 112 ft | +18 ft |
| Wet Braking - ConcreteLower is better | 3rd / 16 | 119 ft | +14 ft |
| Straight AquaHigher is better | 2nd / 16 | 48.7 mph | -0.1 mph |
| Curved AquaplaningHigher is better | 1st / 16 | 11.5 ft/s² | Best in this discipline |
| NoiseLower is better | 14th / 16 | 71.8 dB | +1.80 dB |
| WearHigher is better | 16th / 16 | 16,901 miles | -26,160 miles |
| ValueLower is better | 16th / 16 | 5.11 Price/1000 | +3.34 Price/1000 |
| Fuel ConsumptionLower is better | 7th / 16 | 5.9 l/100km | +0.20 l/100km |
| AbrasionLower is better | 16th / 16 | 102.7 mg/km/t | +54.60 mg/km/t |
- EU Label
- C/A/69
- Price
- 139.00
Curious what you think Jonathan.
I have a RWD Tesla Model 3 in Canada. I have dedicated winter tires I'll be using when temperatures drop. So I figured summer touring tires make sense over an all season touring tire.
The OE Michelin Primacy MXM4s that came with the car are near worn out and I was not blown away by their life despite proper rotation, pressures etc (though I've never owned an EV before and maybe this is the norm).
The shop I've historically dealt with (hopefully unintentionally) mislead me saying the Westlake Z007 (North American equivalent to the Goodride Solmax 1) is just using a one generation old Yokohama design which from what I researched is not the case.
Do you think that a dedicated cheap summer touring (like that Goodride) will at least perform comparably in summer (or near enough) to the Michelin all season touring (MXM4)?
I know what you say about cheap tires... Looking at the performance rankings these tires are not the best, but not horrendouse either. Not something I'd buy again, but they are already mounted and balanced.
I'm deciding whether it's worth making a big deal of it from my local shop and or selling these and buying something else.
Thanks for your input.
In the dry it's like to out perform the MXM4. Wet is a good question, I would hope the Michelin would still have the advantage but I wouldn't really want to be on either of them.
Thanks for the feedback. It's interesting quite how bad the MXM4s seem to sacrifice performance (in both wet and dry) just to cut down rolling resistance. Combine that with low tread life, it seems like a pretty bad tire for the money unless you're trying to eek every last kilometer out of an EVs charge.
Coming into finding your guys' work, I just assumed all season = good in summer and nordic winter = good in winter. I never knew how much difference there was between budget and premium brands, and even between tire types.
It's interesting I found a Tire Rack article showing Cross Climate 2's massively outperforming the MXM4 in both dry and wet handling and breaking. I'm sure in snow it'd be a complete bloodbath (though I have dedicated nordic winter tires anyways).
Then you guys did an all season shootout where a mid tier Kumho summer tire stomped on the Cross Climate 2s in the dry and wet.
So these Goodrides are worse than the Kumho on that test, but at least are hopefully better than the MXM4s I'm coming from.
Shows how important buying the right type of tires is when cheap Goodride summer tires are likely going to outperform (at least in summer conditions) the expensive OEM Michelin tires that have to do everything, while having low rolling resistance.
I'm going to see if the shop will swap them out for the Goodyear or Michelin UUHP summers on test here.
The Goodrides look to perform bad in the wet to a point I don't want to risk my family's safety. And hilariously it's cost per KM is worse than the Goodyear or Michelins because they wear so poor.
Thanks for the help!
The Turanza 6 is farther down than I had expected given how well the all season version has performed in testing…
The AS and summer are totally different tires, they just share the same name. IT seems Bridgestone have given up some grip when aiming for wear, which is a natural trade.