Performance Overview
This radar chart shows relative performance across all test categories, with 100% representing the best performance in each category. Reference tires may have gaps where data is not available.
Dry Performance Overview
Dry Braking (M)
Dry braking in meters (Lower is better)
Dry Handling (s)
Dry handling time in seconds (Lower is better)
Subj. Dry Handling ( Points)
Subjective Dry Handling Score (Higher is better)
Wet Performance Overview
Wet Braking (M)
Wet braking in meters (Lower is better)
Wet Handling (s)
Wet handling time in seconds (Lower is better)
Subj. Wet Handling ( Points)
Subjective Wet Handling Score (Higher is better)
Comfort Performance Overview
Subj. Comfort ( Points)
Subjective Comfort Score (Higher is better)
Subj. Noise ( Points)
Subjective in car noise levels (Higher is better)
Value Performance Overview
Wear (KM)
Predicted tread life in KM (Higher is better)
Value (Price/1000)
Dollars/1000 miles based on mileage warranty (Lower is better)
Price
Price in local currency (Lower is better)
Overall Findings
Based on the weighted scoring from all tests, here are the overall results:
| Position | Tire | Score |
|---|---|---|
| 1 | Continental ExtremeContact DWS 06 PLUS | 97.6% |
| 2 | Pirelli P Zero AS Plus 3 | 97.6% |
| 3 | Falken Azenis FK460 AS | 97.3% |
| 4 | Atlas Force UHP | 95.7% |
| 5 | Vredestein Hypertrac All Season | 94.1% |
| 6 | General G Max AS 05 | 94% |
| 7 | BFGoodrich g Force COMP 2 AS Plus | 93.3% |
Test Winner

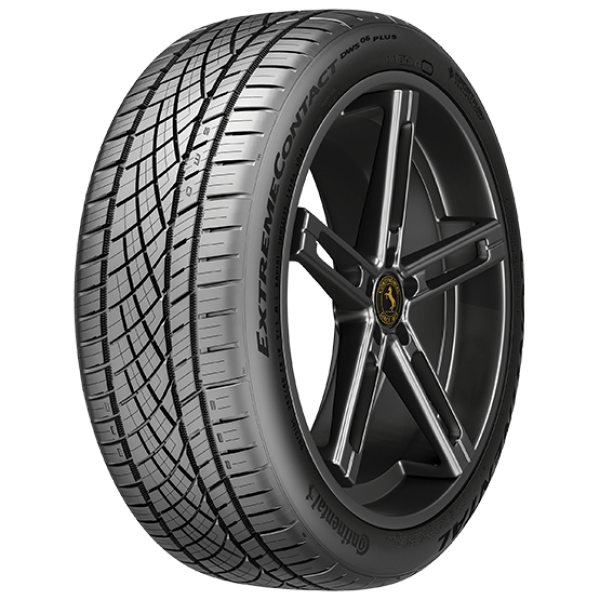
Continental ExtremeContact DWS 06 PLUS
97.6%


