



Below is the data from the 2023 16" ADAC winter tire test.
Noteworthy performers included the Falken EUROWINTER HS02 with good dry braking, Bridgestone Blizzak LM005 showcasing remarkable wet braking, and the Goodyear UltraGrip 9 Plus excelling in snow and ice braking. On the flip side, the Austone SP 901 displayed weaknesses in wet conditions and aquaplaning scenarios. The Fulda Kristall Control HP2 emerged as a durable option with the longest wear, while the Barum Polaris 5 stood out for fuel efficiency.
The biggest surprise is probably the winner. The now aging Dunlop Winter Sport 5 emerged as the overall victor in the 2023 ADAC 16 Inch Tire Test, exhibiting a balanced performance across various testing categories. Its well-rounded performance underscores its reliability and suitability for diverse road conditions, making it a commendable choice for motorists seeking a harmonized blend of safety, comfort, and efficiency
Test setup & methodology
The test setting, the conditions recorded and how the results contribute to the score.
Recorded test conditions
Recorded test conditions
- Dry Braking
- 62.1 → 0.0 mph
- Wet Braking
- 49.7 → 0.0 mph
- Wet Braking - Concrete
- 49.7 → 0.0 mph
- Snow Braking
- 18.6 → 0.0 mph
Dry
In the dry braking test, the Falken EUROWINTER HS02 stood out with a shortest braking distance of 41.4 M, showcasing its superior stopping power on dry surfaces. On the other hand, the Uniroyal WinterExpert lagged with a longer braking distance of 45.6 M, indicating room for improvement in dry braking performance.
Dry Braking
Dry braking in feet (62 - 0 mph)
Lower is better ↓| Position / Tire | Result | Gap to best | Residual speed |
|---|---|---|---|
| 136 ft | Best | 0 mph | |
| 141 ft | +5 ft | 15 mph | |
| 141 ft | +5 ft | 15 mph | |
| 141 ft | +5 ft | 15 mph | |
| 142 ft | +6 ft | 16 mph | |
| 143 ft | +7 ft | 18 mph | |
| 145 ft | +9 ft | 20 mph | |
| 145 ft | +9 ft | 20 mph | |
| 146 ft | +10 ft | 21 mph | |
| 146 ft | +10 ft | 21 mph | |
| 146 ft | +10 ft | 21 mph | |
| 147 ft | +11 ft | 22 mph | |
| 147 ft | +11 ft | 22 mph | |
| 147 ft | +11 ft | 22 mph | |
| 148 ft | +12 ft | 23 mph | |
| 150 ft | +14 ft | 24 mph |
The difference between best and worst was 10.1% (14 ft ≈ 0.9 Car Lengths). From 80 mph, the Uniroyal WinterExpert would still be travelling at 24 mph when the Falken EUROWINTER HS02 had stopped.
Residual speed is calculated from the measured braking distances, assuming constant deceleration; it is not a separate measurement.
Wet
For wet braking the Bridgestone Blizzak LM005 demonstrated excellent braking performance, stopping at a distance of 35.2 M. Conversely, the Austone SP 901 had a less desirable outcome with a braking distance of 45.6 M, showing its limitations in wet conditions.
Wet Braking
Wet braking in feet (50 - 0 mph)
Lower is better ↓| Position / Tire | Result | Gap to best | Residual speed |
|---|---|---|---|
| 115 ft | Best | 0 mph | |
| 118 ft | +3 ft | 11 mph | |
| 119 ft | +4 ft | 15 mph | |
| 121 ft | +6 ft | 17 mph | |
| 121 ft | +6 ft | 17 mph | |
| 122 ft | +7 ft | 19 mph | |
| 125 ft | +10 ft | 22 mph | |
| 126 ft | +11 ft | 23 mph | |
| 126 ft | +11 ft | 23 mph | |
| 127 ft | +12 ft | 24 mph | |
| 128 ft | +13 ft | 25 mph | |
| 128 ft | +13 ft | 25 mph | |
| 130 ft | +15 ft | 26 mph | |
| 131 ft | +16 ft | 28 mph | |
| 135 ft | +20 ft | 31 mph | |
| 150 ft | +35 ft | 38 mph |
The difference between best and worst was 29.5% (35 ft ≈ 2.3 Car Lengths). From 80 mph, the Austone SP 901 would still be travelling at 38 mph when the Bridgestone Blizzak LM005 had stopped.
Residual speed is calculated from the measured braking distances, assuming constant deceleration; it is not a separate measurement.
Again, the Bridgestone Blizzak LM005 showed strong performance on concrete wet surfaces with a braking distance of 36.4 M, indicating its reliable wet grip. The Austone SP 901 again struggled with a distance of 45.1 M, reflecting its weaker performance in these conditions.
Wet Braking - Concrete
Wet braking on Concrete in feet (50 - 0 mph)
Lower is better ↓| Position / Tire | Result | Gap to best | Residual speed |
|---|---|---|---|
| 119 ft | Best | 0 mph | |
| 126 ft | +7 ft | 18 mph | |
| 127 ft | +8 ft | 19 mph | |
| 127 ft | +8 ft | 20 mph | |
| 128 ft | +9 ft | 20 mph | |
| 129 ft | +10 ft | 22 mph | |
| 129 ft | +10 ft | 22 mph | |
| 131 ft | +12 ft | 23 mph | |
| 132 ft | +13 ft | 25 mph | |
| 132 ft | +13 ft | 25 mph | |
| 133 ft | +14 ft | 25 mph | |
| 135 ft | +16 ft | 27 mph | |
| 137 ft | +18 ft | 29 mph | |
| 138 ft | +19 ft | 29 mph | |
| 139 ft | +20 ft | 30 mph | |
| 148 ft | +29 ft | 35 mph |
The difference between best and worst was 23.9% (29 ft ≈ 1.9 Car Lengths). From 80 mph, the Austone SP 901 would still be travelling at 35 mph when the Bridgestone Blizzak LM005 had stopped.
Residual speed is calculated from the measured braking distances, assuming constant deceleration; it is not a separate measurement.
In the straight aquaplaning test, the Firestone Winterhawk 4 exhibited impressive control, maintaining a speed of 56.3 mph. The Austone SP 901, on the other hand, was significantly slower with a speed of 42.9 mph, showing susceptibility to aquaplaning.
Straight Aqua
Float Speed in mph
Higher is better ↑| Position / Tire | Result | Gap to best |
|---|---|---|
| 56.3 mph | Best | |
| 55.2 mph | -1.1 mph | |
| 54.2 mph | -2.1 mph | |
| 53.7 mph | -2.6 mph | |
| 53.6 mph | -2.7 mph | |
| 53.1 mph | -3.2 mph | |
| 53.1 mph | -3.2 mph | |
| 52.8 mph | -3.5 mph | |
| 52.5 mph | -3.8 mph | |
| 52.4 mph | -3.9 mph | |
| 51.7 mph | -4.6 mph | |
| 51.3 mph | -5.0 mph | |
| 51.1 mph | -5.2 mph | |
| 50.6 mph | -5.7 mph | |
| 49.8 mph | -6.5 mph | |
| 42.9 mph | -13.4 mph |
The difference between best and worst was 23.7% (13.4 mph).
The Firestone Winterhawk 4 again showcased superior control in curved aquaplaning scenarios with a speed of 3.9 m/sec², indicating its strong aquaplaning resistance. The Austone SP 901 struggled with a speed of 2.1 m/sec², displaying a higher tendency to lose control.
Curved Aquaplaning
Remaining lateral acceleration
Higher is better ↑| Position / Tire | Result | Gap to best |
|---|---|---|
| 12.8 ft/s² | Best | |
| 12.5 ft/s² | -0.3 ft/s² | |
| 12.5 ft/s² | -0.3 ft/s² | |
| 12.5 ft/s² | -0.3 ft/s² | |
| 12.5 ft/s² | -0.3 ft/s² | |
| 11.8 ft/s² | -1.0 ft/s² | |
| 11.8 ft/s² | -1.0 ft/s² | |
| 11.5 ft/s² | -1.3 ft/s² | |
| 11.5 ft/s² | -1.3 ft/s² | |
| 11.2 ft/s² | -1.6 ft/s² | |
| 11.2 ft/s² | -1.6 ft/s² | |
| 10.8 ft/s² | -2.0 ft/s² | |
| 10.8 ft/s² | -2.0 ft/s² | |
| 10.8 ft/s² | -2.0 ft/s² | |
| 10.5 ft/s² | -2.3 ft/s² | |
| 6.9 ft/s² | -5.9 ft/s² |
The difference between best and worst was 46.2% (5.9 ft/s²).
Snow
In snowy conditions, the Goodyear UltraGrip 9 Plus excelled with a short braking distance of 9.5 M, demonstrating reliable stopping power. In contrast, the Falken EUROWINTER HS02 required a longer distance of 11.4 M to halt, suggesting less effectiveness in snow braking.
Snow Braking
Snow braking in feet (19 - 0 mph)
Lower is better ↓| Position / Tire | Result | Gap to best | Residual speed |
|---|---|---|---|
| 31 ft | Best | 0 mph | |
| 31 ft | Best | 0 mph | |
| 31 ft | Best | 0 mph | |
| 31 ft | Best | 0 mph | |
| 31 ft | 0 ft | 8 mph | |
| 31 ft | 0 ft | 8 mph | |
| 31 ft | 0 ft | 8 mph | |
| 31 ft | 0 ft | 8 mph | |
| 32 ft | +1 ft | 11 mph | |
| 32 ft | +1 ft | 16 mph | |
| 32 ft | +1 ft | 16 mph | |
| 33 ft | +2 ft | 18 mph | |
| 33 ft | +2 ft | 21 mph | |
| 34 ft | +3 ft | 25 mph | |
| 37 ft | +6 ft | 32 mph | |
| 37 ft | +6 ft | 33 mph |
The difference between best and worst was 20% (6 ft ≈ 0.4 Car Lengths). From 80 mph, the Falken EUROWINTER HS02 would still be travelling at 33 mph when the Kleber Krisalp HP3 had stopped.
Residual speed is calculated from the measured braking distances, assuming constant deceleration; it is not a separate measurement.
The BFGoodrich gForce Winter 2 led in snow traction with a force of 265.3 N, indicating strong grip on snowy surfaces. The Lassa Snoways 4, however, showed weaker traction with a force of 223.6 N, hinting at its limitations in snow traction.
Snow Traction
Pulling Force in pounds-force
Higher is better ↑| Position / Tire | Result | Gap to best |
|---|---|---|
| 60 lbf | Best | |
| 59 lbf | -1 lbf | |
| 59 lbf | -1 lbf | |
| 58 lbf | -2 lbf | |
| 58 lbf | -2 lbf | |
| 58 lbf | -2 lbf | |
| 58 lbf | -2 lbf | |
| 58 lbf | -2 lbf | |
| 56 lbf | -4 lbf | |
| 56 lbf | -4 lbf | |
| 56 lbf | -4 lbf | |
| 55 lbf | -5 lbf | |
| 55 lbf | -5 lbf | |
| 53 lbf | -7 lbf | |
| 51 lbf | -9 lbf | |
| 50 lbf | -10 lbf |
The difference between best and worst was 15.7% (10 lbf).
Ice
The Goodyear UltraGrip 9 Plus performed exceptionally in ice braking, stopping at 18.6 M, showcasing its capability on icy surfaces. The Kleber Krisalp HP3 had a longer braking distance of 21.8 M, reflecting a lesser performance on ice.
Ice Braking
Ice braking in feet (20 - 0 )
Lower is better ↓| Position / Tire | Result | Gap to best | Residual speed |
|---|---|---|---|
| 61 ft | Best | 0 mph | |
| 63 ft | +2 ft | 13 mph | |
| 64 ft | +3 ft | 17 mph | |
| 64 ft | +3 ft | 18 mph | |
| 65 ft | +4 ft | 19 mph | |
| 66 ft | +5 ft | 21 mph | |
| 67 ft | +6 ft | 23 mph | |
| 67 ft | +6 ft | 23 mph | |
| 67 ft | +6 ft | 24 mph | |
| 68 ft | +7 ft | 26 mph | |
| 69 ft | +8 ft | 27 mph | |
| 69 ft | +8 ft | 27 mph | |
| 69 ft | +8 ft | 27 mph | |
| 70 ft | +9 ft | 28 mph | |
| 70 ft | +9 ft | 29 mph | |
| 72 ft | +11 ft | 31 mph |
The difference between best and worst was 17.2% (11 ft ≈ 0.7 Car Lengths). From 80 mph, the Kleber Krisalp HP3 would still be travelling at 31 mph when the Goodyear UltraGrip 9+ had stopped.
Residual speed is calculated from the measured braking distances, assuming constant deceleration; it is not a separate measurement.

Comfort
Noise test results indicated a quieter ride with Austone SP 901 registering 70.4 dB, thus offering a more comfortable driving experience. In contrast, the Fulda Kristall Control HP2 was louder with 74.1 dB, which might be perceived as less comfortable.
Noise
External noise in dB
Lower is better ↓| Position / Tire | Result | Gap to best |
|---|---|---|
| 70.4 dB | Best | |
| 70.6 dB | +0.20 dB | |
| 70.8 dB | +0.40 dB | |
| 70.9 dB | +0.50 dB | |
| 71.1 dB | +0.70 dB | |
| 71.1 dB | +0.70 dB | |
| 71.2 dB | +0.80 dB | |
| 71.3 dB | +0.90 dB | |
| 71.3 dB | +0.90 dB | |
| 71.4 dB | +1.00 dB | |
| 71.8 dB | +1.40 dB | |
| 71.8 dB | +1.40 dB | |
| 72.1 dB | +1.70 dB | |
| 72.4 dB | +2.00 dB | |
| 72.8 dB | +2.40 dB | |
| 74.1 dB | +3.70 dB |
The difference between best and worst was 5.3% (3.7 dB).
Value
In the wear test, the Fulda Kristall Control HP2 showcased outstanding durability with 34,983 miles, promising a longer tire lifespan. The Bridgestone Blizzak LM005, however, showed quicker wear with 21,624 miles, indicating a shorter tire lifespan.
Wear
Predicted tread life in KM
Higher is better ↑| Position / Tire | Result | Gap to best |
|---|---|---|
| 34,983 miles | Best | |
| 33,119 miles | -1,864 miles | |
| 29,639 miles | -5,344 miles | |
| 29,142 miles | -5,841 miles | |
| 27,775 miles | -7,208 miles | |
| 27,278 miles | -7,705 miles | |
| 26,160 miles | -8,823 miles | |
| 26,160 miles | -8,823 miles | |
| 25,911 miles | -9,072 miles | |
| 25,911 miles | -9,072 miles | |
| 25,911 miles | -9,072 miles | |
| 24,855 miles | -10,128 miles | |
| 24,047 miles | -10,936 miles | |
| 22,991 miles | -11,992 miles | |
| 22,183 miles | -12,800 miles | |
| 21,624 miles | -13,359 miles |
The difference between best and worst was 38.2% (13,359 miles).
The Barum Polaris 5 proved to be fuel-efficient with a consumption of 5.5 l/100km, making it a more economical choice. The Austone SP 901 consumed more fuel at 5.8 l/100km, making it less economical in comparison.
Fuel Consumption
Fuel consumption in Liters per 100 km
Lower is better ↓| Position / Tire | Result | Gap to best | Extra fuel / year |
|---|---|---|---|
| 5.5 l/100km | Best | $0 | |
| 5.6 l/100km | +0.10 l/100km | $18 | |
| 5.6 l/100km | +0.10 l/100km | $18 | |
| 5.6 l/100km | +0.10 l/100km | $18 | |
| 5.6 l/100km | +0.10 l/100km | $18 | |
| 5.7 l/100km | +0.20 l/100km | $37 | |
| 5.7 l/100km | +0.20 l/100km | $37 | |
| 5.7 l/100km | +0.20 l/100km | $37 | |
| 5.7 l/100km | +0.20 l/100km | $37 | |
| 5.7 l/100km | +0.20 l/100km | $37 | |
| 5.7 l/100km | +0.20 l/100km | $37 | |
| 5.7 l/100km | +0.20 l/100km | $37 | |
| 5.7 l/100km | +0.20 l/100km | $37 | |
| 5.7 l/100km | +0.20 l/100km | $37 | |
| 5.7 l/100km | +0.20 l/100km | $37 | |
| 5.8 l/100km | +0.30 l/100km | $55 |
The difference between best and worst was 5.5% (0.3 l/100km). Over 12,000 miles a year at $3.60/gal, the Austone SP 901 uses about 15 gal ($55) more fuel than the Barum Polaris 5.
Adjust the assumptions
Calculated estimates, not additional measurements. Use the controls to explore the assumptions.
The Michelin Alpin 6 exhibited the lowest abrasion with 51 mg/km/t, suggesting better material endurance. On the other hand, the Uniroyal WinterExpert had higher abrasion at 90 mg/km/t, indicating a propensity for quicker material degradation1.
Abrasion
Weight of Tire Wear Particles Lost (mg/km/t)
Lower is better ↓| Position / Tire | Result | Gap to best |
|---|---|---|
| 51 mg/km/t | Best | |
| 56 mg/km/t | +5.00 mg/km/t | |
| 56 mg/km/t | +5.00 mg/km/t | |
| 62 mg/km/t | +11.00 mg/km/t | |
| 65 mg/km/t | +14.00 mg/km/t | |
| 67 mg/km/t | +16.00 mg/km/t | |
| 69 mg/km/t | +18.00 mg/km/t | |
| 70 mg/km/t | +19.00 mg/km/t | |
| 71 mg/km/t | +20.00 mg/km/t | |
| 71 mg/km/t | +20.00 mg/km/t | |
| 74 mg/km/t | +23.00 mg/km/t | |
| 76 mg/km/t | +25.00 mg/km/t | |
| 78 mg/km/t | +27.00 mg/km/t | |
| 83 mg/km/t | +32.00 mg/km/t | |
| 89 mg/km/t | +38.00 mg/km/t | |
| 90 mg/km/t | +39.00 mg/km/t |
The difference between best and worst was 76.5% (39 mg/km/t).
Results
Dunlop Winter Sport 5
205/60 R16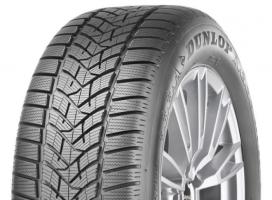
Category scores (% of best)
All discipline results (12)
Discipline positions compare the ranked tires in this test, not the whole market. These are individual measurements, not weighted overall scores.
| Test | Position in discipline | Result | Gap to best |
|---|---|---|---|
| Dry BrakingLower is better | 9th / 16 | 146 ft | +10 ft |
| Wet BrakingLower is better | 6th / 16 | 122 ft | +7 ft |
| Wet Braking - ConcreteLower is better | 6th / 16 | 129 ft | +10 ft |
| Straight AquaHigher is better | 13th / 16 | 51.1 mph | -5.2 mph |
| Curved AquaplaningHigher is better | 6th / 16 | 11.8 ft/s² | -1.0 ft/s² |
| Snow BrakingLower is better | 5th / 16 | 31 ft | 0 ft |
| Snow TractionHigher is better | 4th / 16 | 58 lbf | -2 lbf |
| Ice BrakingLower is better | 4th / 16 | 64 ft | +3 ft |
| NoiseLower is better | 14th / 16 | 72.4 dB | +2.00 dB |
| WearHigher is better | 3rd / 16 | 29,639 miles | -5,344 miles |
| Fuel ConsumptionLower is better | 6th / 16 | 5.7 l/100km | +0.20 l/100km |
| AbrasionLower is better | 7th / 16 | 69 mg/km/t | +18.00 mg/km/t |
- 3PMSF
- Yes
Michelin Alpin 6
205/60 R16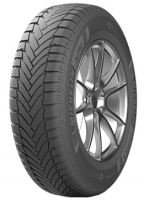
Category scores (% of best)
All discipline results (12)
Discipline positions compare the ranked tires in this test, not the whole market. These are individual measurements, not weighted overall scores.
| Test | Position in discipline | Result | Gap to best |
|---|---|---|---|
| Dry BrakingLower is better | 4th / 16 | 141 ft | +5 ft |
| Wet BrakingLower is better | 3rd / 16 | 119 ft | +4 ft |
| Wet Braking - ConcreteLower is better | 5th / 16 | 128 ft | +9 ft |
| Straight AquaHigher is better | 14th / 16 | 50.6 mph | -5.7 mph |
| Curved AquaplaningHigher is better | 15th / 16 | 10.5 ft/s² | -2.3 ft/s² |
| Snow BrakingLower is better | 14th / 16 | 34 ft | +3 ft |
| Snow TractionHigher is better | 3rd / 16 | 59 lbf | -1 lbf |
| Ice BrakingLower is better | 3rd / 16 | 64 ft | +3 ft |
| NoiseLower is better | 7th / 16 | 71.2 dB | +0.80 dB |
| WearHigher is better | 2nd / 16 | 33,119 miles | -1,864 miles |
| Fuel ConsumptionLower is better | 6th / 16 | 5.7 l/100km | +0.20 l/100km |
| AbrasionLower is better | 1st / 16 | 51 mg/km/t | Best in this discipline |
- 3PMSF
- Yes
Goodyear UltraGrip 9+
205/60 R16
Category scores (% of best)
All discipline results (12)
Discipline positions compare the ranked tires in this test, not the whole market. These are individual measurements, not weighted overall scores.
| Test | Position in discipline | Result | Gap to best |
|---|---|---|---|
| Dry BrakingLower is better | 13th / 16 | 147 ft | +11 ft |
| Wet BrakingLower is better | 4th / 16 | 121 ft | +6 ft |
| Wet Braking - ConcreteLower is better | 9th / 16 | 132 ft | +13 ft |
| Straight AquaHigher is better | 2nd / 16 | 55.2 mph | -1.1 mph |
| Curved AquaplaningHigher is better | 2nd / 16 | 12.5 ft/s² | -0.3 ft/s² |
| Snow BrakingLower is better | 1st / 16 | 31 ft | Best in this discipline |
| Snow TractionHigher is better | 7th / 16 | 58 lbf | -2 lbf |
| Ice BrakingLower is better | 1st / 16 | 61 ft | Best in this discipline |
| NoiseLower is better | 5th / 16 | 71.1 dB | +0.70 dB |
| WearHigher is better | 6th / 16 | 27,278 miles | -7,705 miles |
| Fuel ConsumptionLower is better | 2nd / 16 | 5.6 l/100km | +0.10 l/100km |
| AbrasionLower is better | 11th / 16 | 74 mg/km/t | +23.00 mg/km/t |
- 3PMSF
- Yes
Continental WinterContact TS 870 P
205/60 R16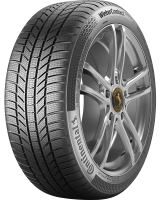
Category scores (% of best)
All discipline results (12)
Discipline positions compare the ranked tires in this test, not the whole market. These are individual measurements, not weighted overall scores.
| Test | Position in discipline | Result | Gap to best |
|---|---|---|---|
| Dry BrakingLower is better | 2nd / 16 | 141 ft | +5 ft |
| Wet BrakingLower is better | 7th / 16 | 125 ft | +10 ft |
| Wet Braking - ConcreteLower is better | 6th / 16 | 129 ft | +10 ft |
| Straight AquaHigher is better | 9th / 16 | 52.5 mph | -3.8 mph |
| Curved AquaplaningHigher is better | 8th / 16 | 11.5 ft/s² | -1.3 ft/s² |
| Snow BrakingLower is better | 10th / 16 | 32 ft | +1 ft |
| Snow TractionHigher is better | 12th / 16 | 55 lbf | -5 lbf |
| Ice BrakingLower is better | 7th / 16 | 67 ft | +6 ft |
| NoiseLower is better | 4th / 16 | 70.9 dB | +0.50 dB |
| WearHigher is better | 9th / 16 | 25,911 miles | -9,072 miles |
| Fuel ConsumptionLower is better | 6th / 16 | 5.7 l/100km | +0.20 l/100km |
| AbrasionLower is better | 9th / 16 | 71 mg/km/t | +20.00 mg/km/t |
- 3PMSF
- Yes
Hankook Winter I cept RS3
205/60 R16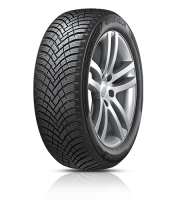
Category scores (% of best)
All discipline results (12)
Discipline positions compare the ranked tires in this test, not the whole market. These are individual measurements, not weighted overall scores.
| Test | Position in discipline | Result | Gap to best |
|---|---|---|---|
| Dry BrakingLower is better | 12th / 16 | 147 ft | +11 ft |
| Wet BrakingLower is better | 4th / 16 | 121 ft | +6 ft |
| Wet Braking - ConcreteLower is better | 4th / 16 | 127 ft | +8 ft |
| Straight AquaHigher is better | 6th / 16 | 53.1 mph | -3.2 mph |
| Curved AquaplaningHigher is better | 10th / 16 | 11.2 ft/s² | -1.6 ft/s² |
| Snow BrakingLower is better | 1st / 16 | 31 ft | Best in this discipline |
| Snow TractionHigher is better | 6th / 16 | 58 lbf | -2 lbf |
| Ice BrakingLower is better | 5th / 16 | 65 ft | +4 ft |
| NoiseLower is better | 11th / 16 | 71.8 dB | +1.40 dB |
| WearHigher is better | 13th / 16 | 24,047 miles | -10,936 miles |
| Fuel ConsumptionLower is better | 6th / 16 | 5.7 l/100km | +0.20 l/100km |
| AbrasionLower is better | 8th / 16 | 70 mg/km/t | +19.00 mg/km/t |
- 3PMSF
- Yes
Bridgestone Blizzak LM005
205/60 R16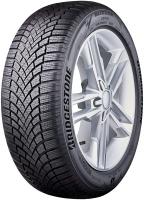
Category scores (% of best)
All discipline results (12)
Discipline positions compare the ranked tires in this test, not the whole market. These are individual measurements, not weighted overall scores.
| Test | Position in discipline | Result | Gap to best |
|---|---|---|---|
| Dry BrakingLower is better | 6th / 16 | 143 ft | +7 ft |
| Wet BrakingLower is better | 1st / 16 | 115 ft | Best in this discipline |
| Wet Braking - ConcreteLower is better | 1st / 16 | 119 ft | Best in this discipline |
| Straight AquaHigher is better | 4th / 16 | 53.7 mph | -2.6 mph |
| Curved AquaplaningHigher is better | 2nd / 16 | 12.5 ft/s² | -0.3 ft/s² |
| Snow BrakingLower is better | 5th / 16 | 31 ft | 0 ft |
| Snow TractionHigher is better | 2nd / 16 | 59 lbf | -1 lbf |
| Ice BrakingLower is better | 11th / 16 | 69 ft | +8 ft |
| NoiseLower is better | 11th / 16 | 71.8 dB | +1.40 dB |
| WearHigher is better | 16th / 16 | 21,624 miles | -13,359 miles |
| Fuel ConsumptionLower is better | 6th / 16 | 5.7 l/100km | +0.20 l/100km |
| AbrasionLower is better | 14th / 16 | 83 mg/km/t | +32.00 mg/km/t |
- 3PMSF
- Yes
Firestone Winterhawk 4
205/60 R16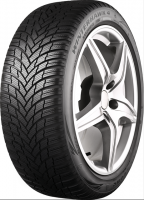
Category scores (% of best)
All discipline results (12)
Discipline positions compare the ranked tires in this test, not the whole market. These are individual measurements, not weighted overall scores.
| Test | Position in discipline | Result | Gap to best |
|---|---|---|---|
| Dry BrakingLower is better | 15th / 16 | 148 ft | +12 ft |
| Wet BrakingLower is better | 2nd / 16 | 118 ft | +3 ft |
| Wet Braking - ConcreteLower is better | 2nd / 16 | 126 ft | +7 ft |
| Straight AquaHigher is better | 1st / 16 | 56.3 mph | Best in this discipline |
| Curved AquaplaningHigher is better | 1st / 16 | 12.8 ft/s² | Best in this discipline |
| Snow BrakingLower is better | 12th / 16 | 33 ft | +2 ft |
| Snow TractionHigher is better | 12th / 16 | 55 lbf | -5 lbf |
| Ice BrakingLower is better | 9th / 16 | 67 ft | +6 ft |
| NoiseLower is better | 3rd / 16 | 70.8 dB | +0.40 dB |
| WearHigher is better | 15th / 16 | 22,183 miles | -12,800 miles |
| Fuel ConsumptionLower is better | 6th / 16 | 5.7 l/100km | +0.20 l/100km |
| AbrasionLower is better | 15th / 16 | 89 mg/km/t | +38.00 mg/km/t |
- 3PMSF
- Yes
BFGoodrich gForce Winter 2
205/60 R16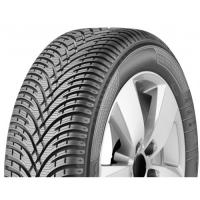
Category scores (% of best)
All discipline results (12)
Discipline positions compare the ranked tires in this test, not the whole market. These are individual measurements, not weighted overall scores.
| Test | Position in discipline | Result | Gap to best |
|---|---|---|---|
| Dry BrakingLower is better | 7th / 16 | 145 ft | +9 ft |
| Wet BrakingLower is better | 13th / 16 | 130 ft | +15 ft |
| Wet Braking - ConcreteLower is better | 12th / 16 | 135 ft | +16 ft |
| Straight AquaHigher is better | 7th / 16 | 53.1 mph | -3.2 mph |
| Curved AquaplaningHigher is better | 8th / 16 | 11.5 ft/s² | -1.3 ft/s² |
| Snow BrakingLower is better | 5th / 16 | 31 ft | 0 ft |
| Snow TractionHigher is better | 1st / 16 | 60 lbf | Best in this discipline |
| Ice BrakingLower is better | 11th / 16 | 69 ft | +8 ft |
| NoiseLower is better | 8th / 16 | 71.3 dB | +0.90 dB |
| WearHigher is better | 9th / 16 | 25,911 miles | -9,072 miles |
| Fuel ConsumptionLower is better | 6th / 16 | 5.7 l/100km | +0.20 l/100km |
| AbrasionLower is better | 2nd / 16 | 56 mg/km/t | +5.00 mg/km/t |
- 3PMSF
- Yes
Fulda Kristall Control HP2
205/60 R16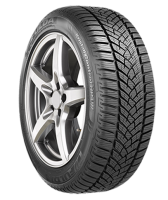
Category scores (% of best)
All discipline results (12)
Discipline positions compare the ranked tires in this test, not the whole market. These are individual measurements, not weighted overall scores.
| Test | Position in discipline | Result | Gap to best |
|---|---|---|---|
| Dry BrakingLower is better | 10th / 16 | 146 ft | +10 ft |
| Wet BrakingLower is better | 15th / 16 | 135 ft | +20 ft |
| Wet Braking - ConcreteLower is better | 14th / 16 | 138 ft | +19 ft |
| Straight AquaHigher is better | 10th / 16 | 52.4 mph | -3.9 mph |
| Curved AquaplaningHigher is better | 2nd / 16 | 12.5 ft/s² | -0.3 ft/s² |
| Snow BrakingLower is better | 9th / 16 | 32 ft | +1 ft |
| Snow TractionHigher is better | 10th / 16 | 56 lbf | -4 lbf |
| Ice BrakingLower is better | 6th / 16 | 66 ft | +5 ft |
| NoiseLower is better | 16th / 16 | 74.1 dB | +3.70 dB |
| WearHigher is better | 1st / 16 | 34,983 miles | Best in this discipline |
| Fuel ConsumptionLower is better | 2nd / 16 | 5.6 l/100km | +0.10 l/100km |
| AbrasionLower is better | 5th / 16 | 65 mg/km/t | +14.00 mg/km/t |
- 3PMSF
- Yes
Kleber Krisalp HP3
205/60 R16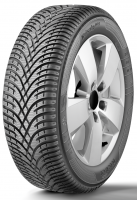
Category scores (% of best)
All discipline results (12)
Discipline positions compare the ranked tires in this test, not the whole market. These are individual measurements, not weighted overall scores.
| Test | Position in discipline | Result | Gap to best |
|---|---|---|---|
| Dry BrakingLower is better | 8th / 16 | 145 ft | +9 ft |
| Wet BrakingLower is better | 8th / 16 | 126 ft | +11 ft |
| Wet Braking - ConcreteLower is better | 11th / 16 | 133 ft | +14 ft |
| Straight AquaHigher is better | 5th / 16 | 53.6 mph | -2.7 mph |
| Curved AquaplaningHigher is better | 10th / 16 | 11.2 ft/s² | -1.6 ft/s² |
| Snow BrakingLower is better | 1st / 16 | 31 ft | Best in this discipline |
| Snow TractionHigher is better | 8th / 16 | 58 lbf | -2 lbf |
| Ice BrakingLower is better | 16th / 16 | 72 ft | +11 ft |
| NoiseLower is better | 2nd / 16 | 70.6 dB | +0.20 dB |
| WearHigher is better | 9th / 16 | 25,911 miles | -9,072 miles |
| Fuel ConsumptionLower is better | 6th / 16 | 5.7 l/100km | +0.20 l/100km |
| AbrasionLower is better | 2nd / 16 | 56 mg/km/t | +5.00 mg/km/t |
- 3PMSF
- Yes
Falken EUROWINTER HS02
205/60 R16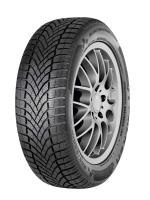
Category scores (% of best)
All discipline results (12)
Discipline positions compare the ranked tires in this test, not the whole market. These are individual measurements, not weighted overall scores.
| Test | Position in discipline | Result | Gap to best |
|---|---|---|---|
| Dry BrakingLower is better | 1st / 16 | 136 ft | Best in this discipline |
| Wet BrakingLower is better | 8th / 16 | 126 ft | +11 ft |
| Wet Braking - ConcreteLower is better | 3rd / 16 | 127 ft | +8 ft |
| Straight AquaHigher is better | 11th / 16 | 51.7 mph | -4.6 mph |
| Curved AquaplaningHigher is better | 12th / 16 | 10.8 ft/s² | -2.0 ft/s² |
| Snow BrakingLower is better | 16th / 16 | 37 ft | +6 ft |
| Snow TractionHigher is better | 15th / 16 | 51 lbf | -9 lbf |
| Ice BrakingLower is better | 7th / 16 | 67 ft | +6 ft |
| NoiseLower is better | 5th / 16 | 71.1 dB | +0.70 dB |
| WearHigher is better | 7th / 16 | 26,160 miles | -8,823 miles |
| Fuel ConsumptionLower is better | 6th / 16 | 5.7 l/100km | +0.20 l/100km |
| AbrasionLower is better | 12th / 16 | 76 mg/km/t | +25.00 mg/km/t |
- 3PMSF
- Yes
Barum Polaris 5
205/60 R16
Category scores (% of best)
All discipline results (12)
Discipline positions compare the ranked tires in this test, not the whole market. These are individual measurements, not weighted overall scores.
| Test | Position in discipline | Result | Gap to best |
|---|---|---|---|
| Dry BrakingLower is better | 11th / 16 | 146 ft | +10 ft |
| Wet BrakingLower is better | 10th / 16 | 127 ft | +12 ft |
| Wet Braking - ConcreteLower is better | 13th / 16 | 137 ft | +18 ft |
| Straight AquaHigher is better | 15th / 16 | 49.8 mph | -6.5 mph |
| Curved AquaplaningHigher is better | 12th / 16 | 10.8 ft/s² | -2.0 ft/s² |
| Snow BrakingLower is better | 10th / 16 | 32 ft | +1 ft |
| Snow TractionHigher is better | 14th / 16 | 53 lbf | -7 lbf |
| Ice BrakingLower is better | 10th / 16 | 68 ft | +7 ft |
| NoiseLower is better | 15th / 16 | 72.8 dB | +2.40 dB |
| WearHigher is better | 4th / 16 | 29,142 miles | -5,841 miles |
| Fuel ConsumptionLower is better | 1st / 16 | 5.5 l/100km | Best in this discipline |
| AbrasionLower is better | 9th / 16 | 71 mg/km/t | +20.00 mg/km/t |
- 3PMSF
- Yes
Vredestein Wintrac
205/60 R16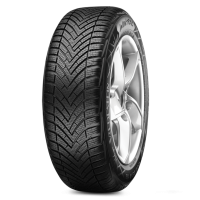
Category scores (% of best)
All discipline results (12)
Discipline positions compare the ranked tires in this test, not the whole market. These are individual measurements, not weighted overall scores.
| Test | Position in discipline | Result | Gap to best |
|---|---|---|---|
| Dry BrakingLower is better | 2nd / 16 | 141 ft | +5 ft |
| Wet BrakingLower is better | 11th / 16 | 128 ft | +13 ft |
| Wet Braking - ConcreteLower is better | 8th / 16 | 131 ft | +12 ft |
| Straight AquaHigher is better | 8th / 16 | 52.8 mph | -3.5 mph |
| Curved AquaplaningHigher is better | 12th / 16 | 10.8 ft/s² | -2.0 ft/s² |
| Snow BrakingLower is better | 13th / 16 | 33 ft | +2 ft |
| Snow TractionHigher is better | 10th / 16 | 56 lbf | -4 lbf |
| Ice BrakingLower is better | 2nd / 16 | 63 ft | +2 ft |
| NoiseLower is better | 8th / 16 | 71.3 dB | +0.90 dB |
| WearHigher is better | 5th / 16 | 27,775 miles | -7,208 miles |
| Fuel ConsumptionLower is better | 2nd / 16 | 5.6 l/100km | +0.10 l/100km |
| AbrasionLower is better | 4th / 16 | 62 mg/km/t | +11.00 mg/km/t |
- 3PMSF
- Yes
Uniroyal WinterExpert
205/60 R16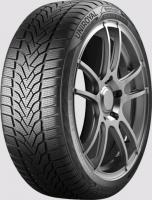
Category scores (% of best)
All discipline results (12)
Discipline positions compare the ranked tires in this test, not the whole market. These are individual measurements, not weighted overall scores.
| Test | Position in discipline | Result | Gap to best |
|---|---|---|---|
| Dry BrakingLower is better | 16th / 16 | 150 ft | +14 ft |
| Wet BrakingLower is better | 11th / 16 | 128 ft | +13 ft |
| Wet Braking - ConcreteLower is better | 15th / 16 | 139 ft | +20 ft |
| Straight AquaHigher is better | 12th / 16 | 51.3 mph | -5.0 mph |
| Curved AquaplaningHigher is better | 6th / 16 | 11.8 ft/s² | -1.0 ft/s² |
| Snow BrakingLower is better | 5th / 16 | 31 ft | 0 ft |
| Snow TractionHigher is better | 9th / 16 | 56 lbf | -4 lbf |
| Ice BrakingLower is better | 11th / 16 | 69 ft | +8 ft |
| NoiseLower is better | 13th / 16 | 72.1 dB | +1.70 dB |
| WearHigher is better | 14th / 16 | 22,991 miles | -11,992 miles |
| Fuel ConsumptionLower is better | 2nd / 16 | 5.6 l/100km | +0.10 l/100km |
| AbrasionLower is better | 16th / 16 | 90 mg/km/t | +39.00 mg/km/t |
- 3PMSF
- Yes
Lassa Snoways 4
205/60 R16
Category scores (% of best)
All discipline results (12)
Discipline positions compare the ranked tires in this test, not the whole market. These are individual measurements, not weighted overall scores.
| Test | Position in discipline | Result | Gap to best |
|---|---|---|---|
| Dry BrakingLower is better | 13th / 16 | 147 ft | +11 ft |
| Wet BrakingLower is better | 14th / 16 | 131 ft | +16 ft |
| Wet Braking - ConcreteLower is better | 10th / 16 | 132 ft | +13 ft |
| Straight AquaHigher is better | 3rd / 16 | 54.2 mph | -2.1 mph |
| Curved AquaplaningHigher is better | 2nd / 16 | 12.5 ft/s² | -0.3 ft/s² |
| Snow BrakingLower is better | 15th / 16 | 37 ft | +6 ft |
| Snow TractionHigher is better | 16th / 16 | 50 lbf | -10 lbf |
| Ice BrakingLower is better | 14th / 16 | 70 ft | +9 ft |
| NoiseLower is better | 10th / 16 | 71.4 dB | +1.00 dB |
| WearHigher is better | 7th / 16 | 26,160 miles | -8,823 miles |
| Fuel ConsumptionLower is better | 6th / 16 | 5.7 l/100km | +0.20 l/100km |
| AbrasionLower is better | 13th / 16 | 78 mg/km/t | +27.00 mg/km/t |
- 3PMSF
- Yes
Austone SP 901
205/60 R16
Category scores (% of best)
All discipline results (12)
Discipline positions compare the ranked tires in this test, not the whole market. These are individual measurements, not weighted overall scores.
| Test | Position in discipline | Result | Gap to best |
|---|---|---|---|
| Dry BrakingLower is better | 5th / 16 | 142 ft | +6 ft |
| Wet BrakingLower is better | 16th / 16 | 150 ft | +35 ft |
| Wet Braking - ConcreteLower is better | 16th / 16 | 148 ft | +29 ft |
| Straight AquaHigher is better | 16th / 16 | 42.9 mph | -13.4 mph |
| Curved AquaplaningHigher is better | 16th / 16 | 6.9 ft/s² | -5.9 ft/s² |
| Snow BrakingLower is better | 1st / 16 | 31 ft | Best in this discipline |
| Snow TractionHigher is better | 4th / 16 | 58 lbf | -2 lbf |
| Ice BrakingLower is better | 15th / 16 | 70 ft | +9 ft |
| NoiseLower is better | 1st / 16 | 70.4 dB | Best in this discipline |
| WearHigher is better | 12th / 16 | 24,855 miles | -10,128 miles |
| Fuel ConsumptionLower is better | 16th / 16 | 5.8 l/100km | +0.30 l/100km |
| AbrasionLower is better | 6th / 16 | 67 mg/km/t | +16.00 mg/km/t |
- 3PMSF
- Yes
Discussion