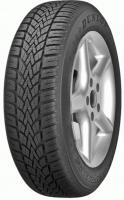
Test Charts / Auto Bild
2024 Auto Bild Winter Tire Test
Compare each discipline in the tested size. See the measured result, position and gap to the best tire, then read the verdict for the trade-offs behind the finishing order.
- Tested size
- 205/55 R16
- Tires tested
- 20
- Disciplines
- 15

Read the measurements, not just the rank
Lower is better for braking distances and lap times; higher is better for subjective scores and aquaplaning speed. Bars start at zero. Read the gap alongside the position: adjacent tires can be separated by very different margins.
Positions and gaps always refer to the full test field within each group. Selecting tires does not recalculate rankings or change the best-in-test benchmark.
Focus on your tires
Select tires to highlight them throughout the charts.
Positions and gaps always refer to the full test field within each group. Selecting tires does not recalculate rankings or change the best-in-test benchmark.
Dry
2Dry Braking
Dry braking in feet (62 - 0 mph)
Lower is better ↓| Position / Tire | Result | Gap to best | Residual speed |
|---|---|---|---|
RefReference Summer |
127 ft | -14 ft | 0 mph |
| 141 ft | Best | 0 mph | |
RefReference All Season |
141 ft | 0 ft | 4 mph |
| 143 ft | +2 ft | 9 mph | |
| 143 ft | +2 ft | 10 mph | |
| 144 ft | +3 ft | 11 mph | |
| 144 ft | +3 ft | 11 mph | |
| 144 ft | +3 ft | 11 mph | |
| 144 ft | +3 ft | 12 mph | |
| 145 ft | +4 ft | 13 mph | |
| 145 ft | +4 ft | 13 mph | |
| 146 ft | +5 ft | 14 mph | |
| 146 ft | +5 ft | 15 mph | |
| 147 ft | +6 ft | 16 mph | |
| 148 ft | +7 ft | 17 mph | |
| 148 ft | +7 ft | 17 mph | |
| 148 ft | +7 ft | 18 mph | |
| 148 ft | +7 ft | 18 mph | |
| 149 ft | +8 ft | 19 mph | |
| 151 ft | +10 ft | 20 mph | |
| 152 ft | +11 ft | 21 mph | |
| 152 ft | +11 ft | 22 mph | |
RefReference Budget |
157 ft | +16 ft | 26 mph |
The difference between best and worst was 24.1% (30 ft ≈ 2.1 Car Lengths). From 80 mph, the Fulda Kristall Control HP2 would still be travelling at 22 mph when the Kumho Winter Craft WP52 had stopped.
Residual speed is calculated from the measured braking distances, assuming constant deceleration; it is not a separate measurement.
Dry Handling
Dry Handling Average Speed
Higher is better ↑| Position / Tire | Result | Gap to best |
|---|---|---|
RefReference Summer |
71.5 mph | +2.8 mph |
RefReference All Season |
70.0 mph | +1.3 mph |
| 68.7 mph | Best | |
| 68.5 mph | -0.2 mph | |
| 68.3 mph | -0.4 mph | |
| 68.3 mph | -0.4 mph | |
| 68.2 mph | -0.5 mph | |
| 68.2 mph | -0.5 mph | |
| 68.1 mph | -0.6 mph | |
| 68.0 mph | -0.7 mph | |
| 67.9 mph | -0.8 mph | |
| 67.9 mph | -0.8 mph | |
| 67.9 mph | -0.8 mph | |
| 67.9 mph | -0.8 mph | |
| 67.8 mph | -0.9 mph | |
| 67.7 mph | -1.0 mph | |
| 67.7 mph | -1.0 mph | |
| 67.7 mph | -1.0 mph | |
| 67.6 mph | -1.1 mph | |
| 67.6 mph | -1.1 mph | |
| 67.3 mph | -1.4 mph | |
| 67.2 mph | -1.5 mph | |
RefReference Budget |
66.1 mph | -2.6 mph |
The difference between best and worst was 7.6% (5.4 mph).

Wet
5Wet Braking
Wet braking in feet (62 - 3 mph)
Lower is better ↓| Position / Tire | Result | Gap to best | Residual speed |
|---|---|---|---|
RefReference Summer |
174 ft | -3 ft | 0 mph |
| 177 ft | Best | 0 mph | |
| 177 ft | Best | 0 mph | |
RefReference All Season |
179 ft | +2 ft | 9 mph |
| 182 ft | +5 ft | 13 mph | |
| 182 ft | +5 ft | 14 mph | |
| 184 ft | +7 ft | 16 mph | |
| 186 ft | +9 ft | 17 mph | |
| 187 ft | +10 ft | 18 mph | |
| 187 ft | +10 ft | 19 mph | |
| 189 ft | +12 ft | 20 mph | |
| 189 ft | +12 ft | 20 mph | |
| 190 ft | +13 ft | 21 mph | |
| 190 ft | +13 ft | 21 mph | |
| 191 ft | +14 ft | 22 mph | |
| 192 ft | +15 ft | 22 mph | |
| 192 ft | +15 ft | 22 mph | |
| 192 ft | +15 ft | 22 mph | |
| 193 ft | +16 ft | 23 mph | |
| 194 ft | +17 ft | 24 mph | |
| 194 ft | +17 ft | 24 mph | |
| 198 ft | +21 ft | 26 mph | |
RefReference Budget |
260 ft | +83 ft | 45 mph |
The difference between best and worst was 49.5% (86 ft ≈ 5.8 Car Lengths). From 80 mph, the Fulda Kristall Control HP2 would still be travelling at 26 mph when the Bridgestone Blizzak 6 had stopped.
Residual speed is calculated from the measured braking distances, assuming constant deceleration; it is not a separate measurement.
Wet Handling
Wet Handling Average Speed
Higher is better ↑| Position / Tire | Result | Gap to best |
|---|---|---|
RefReference Summer |
48.1 mph | +0.9 mph |
| 47.2 mph | Best | |
| 46.7 mph | -0.5 mph | |
| 46.6 mph | -0.6 mph | |
| 46.6 mph | -0.6 mph | |
| 46.5 mph | -0.7 mph | |
| 46.5 mph | -0.7 mph | |
RefReference All Season |
46.3 mph | -0.9 mph |
| 46.2 mph | -1.0 mph | |
| 46.1 mph | -1.1 mph | |
| 46.1 mph | -1.1 mph | |
| 46.1 mph | -1.1 mph | |
| 46.0 mph | -1.2 mph | |
| 45.8 mph | -1.4 mph | |
| 45.7 mph | -1.5 mph | |
| 45.7 mph | -1.5 mph | |
| 45.7 mph | -1.5 mph | |
| 45.5 mph | -1.7 mph | |
| 45.4 mph | -1.8 mph | |
| 45.3 mph | -1.9 mph | |
| 45.2 mph | -2.0 mph | |
| 44.4 mph | -2.8 mph | |
RefReference Budget |
38.7 mph | -8.5 mph |
The difference between best and worst was 19.4% (9.4 mph).
Wet Circle
Wet Circle Lap Time in seconds
Lower is better ↓| Position / Tire | Result | Gap to best |
|---|---|---|
RefReference Summer |
11.64 s | -0.62 s |
| 12.26 s | Best | |
| 12.29 s | +0.03 s | |
RefReference All Season |
12.33 s | +0.07 s |
| 12.38 s | +0.12 s | |
| 12.4 s | +0.14 s | |
| 12.41 s | +0.15 s | |
| 12.44 s | +0.18 s | |
| 12.44 s | +0.18 s | |
| 12.48 s | +0.22 s | |
| 12.52 s | +0.26 s | |
| 12.56 s | +0.30 s | |
| 12.56 s | +0.30 s | |
| 12.56 s | +0.30 s | |
| 12.63 s | +0.37 s | |
| 12.66 s | +0.40 s | |
| 12.67 s | +0.41 s | |
| 12.67 s | +0.41 s | |
| 12.71 s | +0.45 s | |
| 12.72 s | +0.46 s | |
| 12.74 s | +0.48 s | |
| 12.84 s | +0.58 s | |
RefReference Budget |
14.57 s | +2.31 s |
The difference between best and worst was 25.2% (2.93 s).
Straight Aqua
Float Speed in mph
Higher is better ↑| Position / Tire | Result | Gap to best |
|---|---|---|
| 52.5 mph | Best | |
| 52.4 mph | -0.1 mph | |
| 52.1 mph | -0.4 mph | |
| 51.8 mph | -0.7 mph | |
| 51.8 mph | -0.7 mph | |
| 51.3 mph | -1.2 mph | |
| 51.1 mph | -1.4 mph | |
| 51.0 mph | -1.5 mph | |
| 50.4 mph | -2.1 mph | |
| 50.3 mph | -2.2 mph | |
| 50.3 mph | -2.2 mph | |
| 50.3 mph | -2.2 mph | |
| 50.1 mph | -2.4 mph | |
RefReference Summer |
50.0 mph | -2.5 mph |
RefReference All Season |
49.6 mph | -2.9 mph |
| 49.4 mph | -3.1 mph | |
| 49.0 mph | -3.5 mph | |
| 48.8 mph | -3.7 mph | |
| 48.2 mph | -4.3 mph | |
| 46.9 mph | -5.6 mph | |
| 46.8 mph | -5.7 mph | |
| 45.4 mph | -7.1 mph | |
RefReference Budget |
41.1 mph | -11.4 mph |
The difference between best and worst was 21.8% (11.4 mph).
Curved Aquaplaning
Remaining lateral acceleration
Higher is better ↑| Position / Tire | Result | Gap to best |
|---|---|---|
| 12.9 ft/s² | Best | |
| 12.5 ft/s² | -0.4 ft/s² | |
| 12.2 ft/s² | -0.7 ft/s² | |
| 11.9 ft/s² | -1.0 ft/s² | |
| 11.8 ft/s² | -1.1 ft/s² | |
| 11.7 ft/s² | -1.2 ft/s² | |
| 11.7 ft/s² | -1.2 ft/s² | |
| 11.4 ft/s² | -1.5 ft/s² | |
| 11.4 ft/s² | -1.5 ft/s² | |
| 11.2 ft/s² | -1.7 ft/s² | |
| 11.2 ft/s² | -1.7 ft/s² | |
| 10.8 ft/s² | -2.1 ft/s² | |
| 10.5 ft/s² | -2.4 ft/s² | |
RefReference Summer |
10.5 ft/s² | -2.4 ft/s² |
| 10.4 ft/s² | -2.5 ft/s² | |
| 10.4 ft/s² | -2.5 ft/s² | |
| 10.2 ft/s² | -2.7 ft/s² | |
RefReference All Season |
9.7 ft/s² | -3.2 ft/s² |
| 9.6 ft/s² | -3.3 ft/s² | |
| 9.4 ft/s² | -3.5 ft/s² | |
| 8.8 ft/s² | -4.1 ft/s² | |
| 6.5 ft/s² | -6.4 ft/s² | |
RefReference Budget |
4.0 ft/s² | -8.9 ft/s² |
The difference between best and worst was 68.7% (8.9 ft/s²).
Snow
4Snow Braking
Snow braking in feet (31 - 0 mph)
Lower is better ↓| Position / Tire | Result | Gap to best | Residual speed |
|---|---|---|---|
| 95 ft | Best | 0 mph | |
| 95 ft | Best | 0 mph | |
| 95 ft | Best | 0 mph | |
| 96 ft | +1 ft | 5 mph | |
| 96 ft | +1 ft | 5 mph | |
| 96 ft | +1 ft | 7 mph | |
| 96 ft | +1 ft | 7 mph | |
| 96 ft | +1 ft | 8 mph | |
| 96 ft | +1 ft | 8 mph | |
| 97 ft | +2 ft | 9 mph | |
| 97 ft | +2 ft | 10 mph | |
| 97 ft | +2 ft | 10 mph | |
RefReference All Season |
97 ft | +2 ft | 11 mph |
| 97 ft | +2 ft | 11 mph | |
| 98 ft | +3 ft | 14 mph | |
| 99 ft | +4 ft | 15 mph | |
| 99 ft | +4 ft | 15 mph | |
| 99 ft | +4 ft | 16 mph | |
| 100 ft | +5 ft | 18 mph | |
| 101 ft | +6 ft | 19 mph | |
| 101 ft | +6 ft | 19 mph | |
RefReference Budget |
117 ft | +22 ft | 35 mph |
RefReference Summer |
151 ft | +56 ft | 49 mph |
The difference between best and worst was 58.4% (56 ft ≈ 3.8 Car Lengths). From 80 mph, the Firestone Winterhawk 4 would still be travelling at 19 mph when the Continental WinterContact TS 870 had stopped.
Residual speed is calculated from the measured braking distances, assuming constant deceleration; it is not a separate measurement.
Snow Traction
Pulling Force in pounds-force
Higher is better ↑| Position / Tire | Result | Gap to best |
|---|---|---|
| 578 lbf | Best | |
| 568 lbf | -10 lbf | |
| 567 lbf | -11 lbf | |
RefReference All Season |
566 lbf | -12 lbf |
| 565 lbf | -13 lbf | |
| 565 lbf | -13 lbf | |
| 565 lbf | -13 lbf | |
| 564 lbf | -14 lbf | |
| 560 lbf | -18 lbf | |
| 559 lbf | -19 lbf | |
| 558 lbf | -20 lbf | |
| 558 lbf | -20 lbf | |
| 557 lbf | -21 lbf | |
| 552 lbf | -26 lbf | |
| 551 lbf | -27 lbf | |
| 551 lbf | -27 lbf | |
| 551 lbf | -27 lbf | |
| 550 lbf | -28 lbf | |
| 546 lbf | -32 lbf | |
| 546 lbf | -32 lbf | |
| 511 lbf | -67 lbf | |
RefReference Budget |
402 lbf | -176 lbf |
RefReference Summer |
191 lbf | -387 lbf |
The difference between best and worst was 67% (387 lbf).
Snow Handling
Snow handling average speed
Higher is better ↑| Position / Tire | Result | Gap to best |
|---|---|---|
| 37.8 mph | Best | |
| 37.5 mph | -0.3 mph | |
| 37.4 mph | -0.4 mph | |
| 37.3 mph | -0.5 mph | |
| 37.3 mph | -0.5 mph | |
| 37.2 mph | -0.6 mph | |
| 37.0 mph | -0.8 mph | |
| 37.0 mph | -0.8 mph | |
| 37.0 mph | -0.8 mph | |
RefReference All Season |
37.0 mph | -0.8 mph |
| 37.0 mph | -0.8 mph | |
| 36.9 mph | -0.9 mph | |
| 36.8 mph | -1.0 mph | |
| 36.7 mph | -1.1 mph | |
| 36.7 mph | -1.1 mph | |
| 36.7 mph | -1.1 mph | |
| 36.5 mph | -1.3 mph | |
| 36.4 mph | -1.4 mph | |
| 36.4 mph | -1.4 mph | |
| 36.0 mph | -1.8 mph | |
| 35.7 mph | -2.1 mph | |
RefReference Budget |
34.7 mph | -3.1 mph |
The difference between best and worst was 8.2% (3.1 mph).
Snow Slalom
Lateral acceleration
Higher is better ↑| Position / Tire | Result | Gap to best |
|---|---|---|
| 10.9 ft/s² | Best | |
| 10.9 ft/s² | Best | |
| 10.9 ft/s² | Best | |
| 10.8 ft/s² | -0.1 ft/s² | |
| 10.8 ft/s² | -0.1 ft/s² | |
| 10.8 ft/s² | -0.1 ft/s² | |
| 10.7 ft/s² | -0.2 ft/s² | |
| 10.7 ft/s² | -0.2 ft/s² | |
| 10.7 ft/s² | -0.2 ft/s² | |
| 10.6 ft/s² | -0.3 ft/s² | |
| 10.6 ft/s² | -0.3 ft/s² | |
| 10.6 ft/s² | -0.3 ft/s² | |
| 10.6 ft/s² | -0.3 ft/s² | |
| 10.5 ft/s² | -0.4 ft/s² | |
| 10.5 ft/s² | -0.4 ft/s² | |
RefReference All Season |
10.5 ft/s² | -0.4 ft/s² |
| 10.4 ft/s² | -0.5 ft/s² | |
| 10.3 ft/s² | -0.6 ft/s² | |
| 10.3 ft/s² | -0.6 ft/s² | |
| 10.3 ft/s² | -0.6 ft/s² | |
| 10.2 ft/s² | -0.7 ft/s² | |
RefReference Budget |
8.9 ft/s² | -2.0 ft/s² |
RefReference Summer |
4.5 ft/s² | -6.4 ft/s² |
The difference between best and worst was 58.3% (6.4 ft/s²).
Comfort
1Noise
External noise in dB
Lower is better ↓| Position / Tire | Result | Gap to best |
|---|---|---|
| 70.3 dB | Best | |
| 70.8 dB | +0.50 dB | |
| 70.8 dB | +0.50 dB | |
| 70.9 dB | +0.60 dB | |
RefReference All Season |
71 dB | +0.70 dB |
| 71 dB | +0.70 dB | |
| 71.2 dB | +0.90 dB | |
| 71.2 dB | +0.90 dB | |
| 71.4 dB | +1.10 dB | |
| 71.4 dB | +1.10 dB | |
| 71.6 dB | +1.30 dB | |
| 71.6 dB | +1.30 dB | |
| 71.7 dB | +1.40 dB | |
| 71.7 dB | +1.40 dB | |
| 71.8 dB | +1.50 dB | |
| 72.1 dB | +1.80 dB | |
| 72.1 dB | +1.80 dB | |
| 72.2 dB | +1.90 dB | |
| 72.3 dB | +2.00 dB | |
| 72.5 dB | +2.20 dB | |
| 72.9 dB | +2.60 dB | |
RefReference Summer |
73.4 dB | +3.10 dB |
RefReference Budget |
74.2 dB | +3.90 dB |
The difference between best and worst was 5.5% (3.9 dB).
Value
3Wear
Predicted tread life in KM
Higher is better ↑| Position / Tire | Result | Gap to best |
|---|---|---|
| 31,379 miles | Best | |
| 31,224 miles | -155 miles | |
| 30,255 miles | -1,124 miles | |
| 29,956 miles | -1,423 miles | |
| 29,807 miles | -1,572 miles | |
| 29,515 miles | -1,864 miles | |
| 28,297 miles | -3,082 miles | |
| 27,844 miles | -3,535 miles | |
| 27,527 miles | -3,852 miles | |
| 25,980 miles | -5,399 miles | |
| 25,930 miles | -5,449 miles | |
| 25,681 miles | -5,698 miles | |
| 25,103 miles | -6,276 miles | |
| 24,755 miles | -6,624 miles | |
| 24,544 miles | -6,835 miles | |
| 24,047 miles | -7,332 miles | |
| 23,820 miles | -7,559 miles | |
| 23,239 miles | -8,140 miles | |
| 23,214 miles | -8,165 miles | |
| 23,208 miles | -8,171 miles |
The difference between best and worst was 26% (8,171 miles).
Value
Euros/1000km based on cost/wear
Lower is better ↓| Position / Tire | Result | Gap to best | cost per 1,000 miles |
|---|---|---|---|
| 6.64 Price/1000 | Best | €16.70 | |
| 7.16 Price/1000 | +0.52 Price/1000 | €16.34 | |
| 7.3 Price/1000 | +0.66 Price/1000 | €23.51 | |
| 7.47 Price/1000 | +0.83 Price/1000 | €16.59 | |
| 7.8 Price/1000 | +1.16 Price/1000 | €18.03 | |
| 8.03 Price/1000 | +1.39 Price/1000 | €22.52 | |
| 8.1 Price/1000 | +1.46 Price/1000 | €15.89 | |
| 8.56 Price/1000 | +1.92 Price/1000 | €21.10 | |
| 8.57 Price/1000 | +1.93 Price/1000 | €27.13 | |
| 8.61 Price/1000 | +1.97 Price/1000 | €26.12 | |
| 8.63 Price/1000 | +1.99 Price/1000 | €24.35 | |
| 9.19 Price/1000 | +2.55 Price/1000 | €24.53 | |
| 9.26 Price/1000 | +2.62 Price/1000 | €22.65 | |
| 9.37 Price/1000 | +2.73 Price/1000 | €34.35 | |
| 9.41 Price/1000 | +2.77 Price/1000 | €22.19 | |
| 9.59 Price/1000 | +2.95 Price/1000 | €20.99 | |
| 10.17 Price/1000 | +3.53 Price/1000 | €33.80 | |
| 10.3 Price/1000 | +3.66 Price/1000 | €23.59 | |
| 10.85 Price/1000 | +4.21 Price/1000 | €29.42 | |
| 11.29 Price/1000 | +4.65 Price/1000 | €29.40 |
The difference between best and worst was 70% (4.65 Price/1000). Over 25,000 miles the cheapest tire to own (Barum Polaris 5) works out €461 cheaper than the most expensive (Giti GitiWinterW2).
How this is calculated
Assumes a typical car doing 29 mpg (rolling resistance causing 20% of fuel use), fuel at €6.25 per gallon and €70 fitting per set of four. Purchase prices are from the time of the 2024 test; financing costs are excluded.
Rolling Resistance
Rolling resistance in kg t
Lower is better ↓| Position / Tire | Result | Gap to best | Extra fuel / year |
|---|---|---|---|
| 7.28 kg/t | Best | $0 | |
| 7.64 kg/t | +0.36 kg/t | $15 | |
| 7.72 kg/t | +0.44 kg/t | $18 | |
| 7.82 kg/t | +0.54 kg/t | $22 | |
| 7.83 kg/t | +0.55 kg/t | $22 | |
| 7.91 kg/t | +0.63 kg/t | $25 | |
| 8.01 kg/t | +0.73 kg/t | $29 | |
| 8.02 kg/t | +0.74 kg/t | $30 | |
| 8.1 kg/t | +0.82 kg/t | $33 | |
| 8.2 kg/t | +0.92 kg/t | $37 | |
| 8.44 kg/t | +1.16 kg/t | $47 | |
| 8.48 kg/t | +1.20 kg/t | $48 | |
| 8.61 kg/t | +1.33 kg/t | $54 | |
| 8.77 kg/t | +1.49 kg/t | $60 | |
| 8.79 kg/t | +1.51 kg/t | $61 | |
| 8.83 kg/t | +1.55 kg/t | $63 | |
| 8.92 kg/t | +1.64 kg/t | $66 | |
| 9.05 kg/t | +1.77 kg/t | $71 | |
| 9.75 kg/t | +2.47 kg/t | $100 | |
| 10.15 kg/t | +2.87 kg/t | $116 |
The difference between best and worst was 39.4% (2.87 kg / t). Over 12,000 miles a year at $3.60/gal, the Giti GitiWinterW2 uses about 32 gal ($116) more fuel than the Barum Polaris 5.
Adjust the assumptions
Calculated estimates, not additional measurements. Use the controls to explore the assumptions. These calculators use the full test field, independently of your tire selection above.
Test setup & methodology
The test setting, the conditions recorded and how the results contribute to the score.
Recorded test conditions
Recorded test conditions
- Dry Braking
- 62.1 → 0.0 mph
- Wet Braking
- 62.1 → 3.1 mph
- Snow Braking
- 31.1 → 0.0 mph
More tire tests
Cross-check this test
Where these tires were tested again, and how the verdict held up.
2024 Winter 55 Tire Braking Test
205/55 R1655 tires tested
19 of these 20 tires tested again
2023 Winter Tire Test 54 Set Braking Test
225/45 R1854 tires tested
12 of these 20 tires tested again
2025 Winter Tire Braking Test - 52 Sets!
225/40 R1851 tires tested
11 of these 20 tires tested again