



 Famously, ADAC are not fans of all season tires, seeing them as too compromised for year round motoring and insisting that a summer and winter tire combination is superior.
This means ADAC have not tested all season tires since 2020, so lets see if the modern batch of all season tires can change ADACs mind!
Test setup & methodology
The test setting, the conditions recorded and how the results contribute to the score.
Recorded test conditions
Recorded test conditions
- Dry Braking
- 62.1 → 0.0 mph
- Wet Braking
- 49.7 → 0.0 mph
- Wet Braking - Concrete
- 49.7 → 0.0 mph
- Snow Braking
- 18.6 → 0.0 mph
ADAC tested 16 all-season tire models in the popular 205/55 R16 size, but sadly started their testing before the public availability of the new Continental AllSeasonContact 2 which won the tire reviews test this year, the vastly improved Pirelli Cinturato All Season SF3 and the Bridgestone Turanza All Season 6. The tires were assessed under various conditions including summer, winter, and wet scenarios, with the overall score comprising 70% for driving safety and 30% for environmental impact.
It seems modern all season tires have improved, as an all-season tire received a "good" overall rating for the first time. The Goodyear Vector 4Seasons Gen-3 claimed this honor, demonstrating good performance in wet and winter conditions, though showing slight weaknesses in dry summer conditions. Following closely was the Pirelli Cinturato All Season SF2, which proved to be an excellent choice for low-mileage drivers with good performance across all conditions.
While seven out of the 16 tires tested were rated as "recommended," the remaining nine failed to meet the mark. Some tires exhibited specific strengths in certain conditions but fell short in others, highlighting the ongoing challenge of creating a truly well-balanced all-season tire.
Despite the improvements seen in some models, the test also exposed persistent issues. Seven tires were rated only as "adequate," and two were deemed "poor," with many showing significant weaknesses particularly in dry conditions. This underscores that while progress has been made, all-season tires are not yet universal all-rounders.
ADAC concludes that drivers should carefully consider their specific driving profile when choosing between all-season tires and dedicated summer/winter tires. The test emphasizes that performance, rather than price, should be the primary consideration in tire selection. While all-season tires have certainly improved, they may not be the optimal choice for all drivers or all driving conditions.
Dry
Without the new challengers from Continental, Pirelli and Bridgestone, dry braking was once again led by the Michelin Crossclimate 2, with the Uniroyal struggling to get the car slowed down, taking over 23 feet more to stop from 62mph.
Dry Braking
Dry braking in feet (62 - 0 mph)
Lower is better ↓| Position / Tire | Result | Gap to best | Residual speed |
|---|---|---|---|
| 130 ft | Best | 0 mph | |
| 133 ft | +3 ft | 12 mph | |
| 138 ft | +8 ft | 20 mph | |
| 140 ft | +10 ft | 22 mph | |
| 142 ft | +12 ft | 23 mph | |
| 142 ft | +12 ft | 23 mph | |
| 145 ft | +15 ft | 26 mph | |
| 145 ft | +15 ft | 26 mph | |
| 145 ft | +15 ft | 26 mph | |
| 146 ft | +16 ft | 27 mph | |
| 147 ft | +17 ft | 28 mph | |
| 147 ft | +17 ft | 28 mph | |
| 148 ft | +18 ft | 28 mph | |
| 151 ft | +21 ft | 30 mph | |
| 151 ft | +21 ft | 30 mph | |
| 153 ft | +23 ft | 31 mph |
The difference between best and worst was 18% (23 ft ≈ 1.6 Car Lengths). From 80 mph, the Uniroyal AllSeasonExpert 2 would still be travelling at 31 mph when the Michelin CrossClimate 2 had stopped.
Residual speed is calculated from the measured braking distances, assuming constant deceleration; it is not a separate measurement.
Wet
In wet braking, the Pirelli Cinturato All Season SF2 took the top spot, while the Infinity Ecofour lagged behind, needing over 16 feet more to come to a stop from 50 mph.
Wet Braking
Wet braking in feet (50 - 0 mph)
Lower is better ↓| Position / Tire | Result | Gap to best | Residual speed |
|---|---|---|---|
| 109 ft | Best | 0 mph | |
| 110 ft | +1 ft | 8 mph | |
| 113 ft | +4 ft | 14 mph | |
| 114 ft | +5 ft | 16 mph | |
| 114 ft | +5 ft | 17 mph | |
| 115 ft | +6 ft | 18 mph | |
| 115 ft | +6 ft | 18 mph | |
| 115 ft | +6 ft | 18 mph | |
| 116 ft | +7 ft | 19 mph | |
| 118 ft | +9 ft | 22 mph | |
| 118 ft | +9 ft | 22 mph | |
| 119 ft | +10 ft | 23 mph | |
| 123 ft | +14 ft | 27 mph | |
| 124 ft | +15 ft | 28 mph | |
| 125 ft | +16 ft | 28 mph | |
| 127 ft | +18 ft | 30 mph |
The difference between best and worst was 15.9% (18 ft ≈ 1.2 Car Lengths). From 80 mph, the Infinity Ecofour would still be travelling at 30 mph when the Pirelli Cinturato All Season SF2 had stopped.
Residual speed is calculated from the measured braking distances, assuming constant deceleration; it is not a separate measurement.
On concrete surfaces in wet conditions, the Pirelli Cinturato All Season SF2 maintained its lead, with the Infinity Ecofour again showing the poorest performance, requiring over 26 feet more to stop.
Wet Braking - Concrete
Wet braking on Concrete in feet (50 - 0 mph)
Lower is better ↓| Position / Tire | Result | Gap to best | Residual speed |
|---|---|---|---|
| 123 ft | Best | 0 mph | |
| 128 ft | +5 ft | 15 mph | |
| 129 ft | +6 ft | 17 mph | |
| 131 ft | +8 ft | 20 mph | |
| 131 ft | +8 ft | 20 mph | |
| 132 ft | +9 ft | 21 mph | |
| 133 ft | +10 ft | 22 mph | |
| 134 ft | +11 ft | 23 mph | |
| 135 ft | +12 ft | 24 mph | |
| 135 ft | +12 ft | 24 mph | |
| 139 ft | +16 ft | 27 mph | |
| 141 ft | +18 ft | 29 mph | |
| 142 ft | +19 ft | 29 mph | |
| 144 ft | +21 ft | 31 mph | |
| 146 ft | +23 ft | 32 mph | |
| 151 ft | +28 ft | 34 mph |
The difference between best and worst was 22.4% (28 ft ≈ 1.9 Car Lengths). From 80 mph, the Infinity Ecofour would still be travelling at 34 mph when the Pirelli Cinturato All Season SF2 had stopped.
Residual speed is calculated from the measured braking distances, assuming constant deceleration; it is not a separate measurement.
In straight aquaplaning tests, the Uniroyal AllSeasonExpert 2 once again showed its deep water abilities by achieving the highest float speed, while the Infinity Ecofour struggled, with a float speed nearly 8 mph lower.
Straight Aqua
Float Speed in mph
Higher is better ↑| Position / Tire | Result | Gap to best |
|---|---|---|
| 51.1 mph | Best | |
| 50.3 mph | -0.8 mph | |
| 50.3 mph | -0.8 mph | |
| 50.2 mph | -0.9 mph | |
| 49.3 mph | -1.8 mph | |
| 48.9 mph | -2.2 mph | |
| 48.8 mph | -2.3 mph | |
| 48.7 mph | -2.4 mph | |
| 48.3 mph | -2.8 mph | |
| 48.3 mph | -2.8 mph | |
| 48.3 mph | -2.8 mph | |
| 46.5 mph | -4.6 mph | |
| 46.0 mph | -5.1 mph | |
| 45.6 mph | -5.5 mph | |
| 44.9 mph | -6.2 mph | |
| 43.1 mph | -8.0 mph |
The difference between best and worst was 15.7% (8 mph).
The Uniroyal AllSeasonExpert 2 continued to impress in deep water, leading the curved aquaplaning test, while the Infinity Ecofour showed the least resistance to aquaplaning in curves.
Curved Aquaplaning
Remaining lateral acceleration
Higher is better ↑| Position / Tire | Result | Gap to best |
|---|---|---|
| 11.8 ft/s² | Best | |
| 11.2 ft/s² | -0.6 ft/s² | |
| 11.2 ft/s² | -0.6 ft/s² | |
| 10.8 ft/s² | -1.0 ft/s² | |
| 10.8 ft/s² | -1.0 ft/s² | |
| 10.8 ft/s² | -1.0 ft/s² | |
| 10.8 ft/s² | -1.0 ft/s² | |
| 10.8 ft/s² | -1.0 ft/s² | |
| 10.5 ft/s² | -1.3 ft/s² | |
| 9.8 ft/s² | -2.0 ft/s² | |
| 9.5 ft/s² | -2.3 ft/s² | |
| 9.2 ft/s² | -2.6 ft/s² | |
| 9.2 ft/s² | -2.6 ft/s² | |
| 8.5 ft/s² | -3.3 ft/s² | |
| 8.2 ft/s² | -3.6 ft/s² | |
| 7.9 ft/s² | -3.9 ft/s² |
The difference between best and worst was 33.3% (3.9 ft/s²).
Snow
In snow braking tests, the Semperit AllSeason Grip proved most effective, while the Pirelli Cinturato All Season SF2, despite its strong wet performance, required 7 feet more to stop on snow.
Snow Braking
Snow braking in feet (19 - 0 mph)
Lower is better ↓| Position / Tire | Result | Gap to best | Residual speed |
|---|---|---|---|
| 33 ft | Best | 0 mph | |
| 34 ft | +1 ft | 16 mph | |
| 34 ft | +1 ft | 17 mph | |
| 35 ft | +2 ft | 19 mph | |
| 35 ft | +2 ft | 20 mph | |
| 35 ft | +2 ft | 20 mph | |
| 35 ft | +2 ft | 20 mph | |
| 36 ft | +3 ft | 25 mph | |
| 37 ft | +4 ft | 28 mph | |
| 37 ft | +4 ft | 28 mph | |
| 37 ft | +4 ft | 28 mph | |
| 37 ft | +4 ft | 28 mph | |
| 38 ft | +5 ft | 30 mph | |
| 38 ft | +5 ft | 30 mph | |
| 39 ft | +6 ft | 32 mph | |
| 39 ft | +6 ft | 33 mph |
The difference between best and worst was 20% (6 ft ≈ 0.4 Car Lengths). From 80 mph, the Pirelli Cinturato All Season SF2 would still be travelling at 33 mph when the Semperit AllSeason Grip had stopped.
Residual speed is calculated from the measured braking distances, assuming constant deceleration; it is not a separate measurement.
The Sava All Weather demonstrated the best snow traction, while the Kenda Kenetica 4S struggled to gain grip, producing over 40 N less pulling force.
Snow Traction
Pulling Force in pounds-force
Higher is better ↑| Position / Tire | Result | Gap to best |
|---|---|---|
| 53 lbf | Best | |
| 51 lbf | -2 lbf | |
| 51 lbf | -2 lbf | |
| 50 lbf | -3 lbf | |
| 49 lbf | -4 lbf | |
| 49 lbf | -4 lbf | |
| 49 lbf | -4 lbf | |
| 49 lbf | -4 lbf | |
| 48 lbf | -5 lbf | |
| 48 lbf | -5 lbf | |
| 47 lbf | -6 lbf | |
| 47 lbf | -6 lbf | |
| 47 lbf | -6 lbf | |
| 45 lbf | -8 lbf | |
| 43 lbf | -10 lbf | |
| 43 lbf | -10 lbf |
The difference between best and worst was 18.3% (10 lbf).
Ice
On icy surfaces, the Pirelli Cinturato All Season SF2 redeemed itself with the shortest braking distance, while the Kenda Kenetica 4S required 13 feet more to come to a stop.
Ice Braking
Ice braking in feet
Lower is better ↓| Position / Tire | Result | Gap to best |
|---|---|---|
| 59 ft | Best | |
| 59 ft | 0 ft | |
| 61 ft | +2 ft | |
| 61 ft | +2 ft | |
| 62 ft | +3 ft | |
| 63 ft | +4 ft | |
| 64 ft | +5 ft | |
| 64 ft | +5 ft | |
| 65 ft | +6 ft | |
| 65 ft | +6 ft | |
| 67 ft | +8 ft | |
| 67 ft | +8 ft | |
| 69 ft | +10 ft | |
| 70 ft | +11 ft | |
| 70 ft | +11 ft | |
| 72 ft | +13 ft |
The difference between best and worst was 22.2% (13 ft ≈ 0.9 Car Lengths).

Comfort
In terms of external noise, the Nankang Cross Seasons AW6, Pirelli Cinturato All Season SF2, and Goodyear Vector 4Seasons Gen 3 tied for the quietest performance, while the Falken EUROALL SEASON AS210 was the noisiest.
Noise
External noise in dB
Lower is better ↓| Position / Tire | Result | Gap to best |
|---|---|---|
| 70.6 dB | Best | |
| 70.6 dB | Best | |
| 70.6 dB | Best | |
| 71.1 dB | +0.50 dB | |
| 71.1 dB | +0.50 dB | |
| 71.4 dB | +0.80 dB | |
| 71.4 dB | +0.80 dB | |
| 71.4 dB | +0.80 dB | |
| 71.4 dB | +0.80 dB | |
| 71.5 dB | +0.90 dB | |
| 71.5 dB | +0.90 dB | |
| 71.9 dB | +1.30 dB | |
| 71.9 dB | +1.30 dB | |
| 72.1 dB | +1.50 dB | |
| 72.2 dB | +1.60 dB | |
| 72.3 dB | +1.70 dB |
All the tires in the Noise test finished less than 3% apart.
The Sava All Weather proved to be the lightest tire in the test, while the Yokohama BluEarth 4S AW21 was the heaviest, weighing over 2 kg more per tire.
Tire Weight
Tire Weight Per Set
Lower is better ↓| Position / Tire | Result | Gap to best |
|---|---|---|
| 17.4 lb | Best | |
| 17.6 lb | +0.2 lb | |
| 17.6 lb | +0.2 lb | |
| 17.9 lb | +0.5 lb | |
| 18.1 lb | +0.7 lb | |
| 18.3 lb | +0.9 lb | |
| 18.5 lb | +1.1 lb | |
| 18.5 lb | +1.1 lb | |
| 18.7 lb | +1.3 lb | |
| 19.2 lb | +1.8 lb | |
| 19.4 lb | +2.0 lb | |
| 19.6 lb | +2.2 lb | |
| 20.1 lb | +2.7 lb | |
| 20.1 lb | +2.7 lb | |
| 21.8 lb | +4.4 lb | |
| 22.3 lb | +4.9 lb |
The difference between best and worst was 27.8% (4.9 lb).
Value
In the wear test, the Goodyear Vector 4Seasons Gen 3 showed impressive longevity with a projected lifespan of over 37,282 miles, nearly double that of the least durable tire, the Pirelli Cinturato All Season SF2.
Wear
Predicted tread life in KM
Higher is better ↑| Position / Tire | Result | Gap to best |
|---|---|---|
| 37,717 miles | Best | |
| 32,001 miles | -5,716 miles | |
| 31,441 miles | -6,276 miles | |
| 31,193 miles | -6,524 miles | |
| 29,826 miles | -7,891 miles | |
| 29,826 miles | -7,891 miles | |
| 27,589 miles | -10,128 miles | |
| 27,340 miles | -10,377 miles | |
| 27,092 miles | -10,625 miles | |
| 26,533 miles | -11,184 miles | |
| 25,973 miles | -11,744 miles | |
| 24,855 miles | -12,862 miles | |
| 23,239 miles | -14,478 miles | |
| 22,121 miles | -15,596 miles | |
| 21,064 miles | -16,653 miles | |
| 20,505 miles | -17,212 miles |
The difference between best and worst was 45.6% (17,212 miles).
The Vredestein Quatrac, Sava All Weather, and Infinity Ecofour tied for the best fuel efficiency, while the Kenda Kenetica 4S and Yokohama BluEarth 4S AW21 were the least efficient, consuming 0.3 l/100km more.
Fuel Consumption
Fuel consumption in Liters per 100 km
Lower is better ↓| Position / Tire | Result | Gap to best | Extra fuel / year |
|---|---|---|---|
| 5.2 l/100km | Best | $0 | |
| 5.2 l/100km | Best | $0 | |
| 5.2 l/100km | Best | $0 | |
| 5.3 l/100km | +0.10 l/100km | $18 | |
| 5.3 l/100km | +0.10 l/100km | $18 | |
| 5.3 l/100km | +0.10 l/100km | $18 | |
| 5.3 l/100km | +0.10 l/100km | $18 | |
| 5.4 l/100km | +0.20 l/100km | $37 | |
| 5.4 l/100km | +0.20 l/100km | $37 | |
| 5.4 l/100km | +0.20 l/100km | $37 | |
| 5.4 l/100km | +0.20 l/100km | $37 | |
| 5.4 l/100km | +0.20 l/100km | $37 | |
| 5.4 l/100km | +0.20 l/100km | $37 | |
| 5.41 l/100km | +0.21 l/100km | $39 | |
| 5.5 l/100km | +0.30 l/100km | $55 | |
| 5.5 l/100km | +0.30 l/100km | $55 |
The difference between best and worst was 5.8% (0.3 l/100km). Over 12,000 miles a year at $3.60/gal, the Yokohama BluEarth 4S AW21 uses about 15 gal ($55) more fuel than the Infinity Ecofour.
Adjust the assumptions
Calculated estimates, not additional measurements. Use the controls to explore the assumptions.
The Michelin CrossClimate 2 showed the least tire wear particles lost, indicating good compound durability, while the Yokohama BluEarth 4S AW21 lost nearly twice as much material during testing.
Abrasion
Weight of Tire Wear Particles Lost (mg/km/t)
Lower is better ↓| Position / Tire | Result | Gap to best |
|---|---|---|
| 52 mg/km/t | Best | |
| 56 mg/km/t | +4.00 mg/km/t | |
| 56 mg/km/t | +4.00 mg/km/t | |
| 57 mg/km/t | +5.00 mg/km/t | |
| 59 mg/km/t | +7.00 mg/km/t | |
| 59 mg/km/t | +7.00 mg/km/t | |
| 60 mg/km/t | +8.00 mg/km/t | |
| 63 mg/km/t | +11.00 mg/km/t | |
| 69 mg/km/t | +17.00 mg/km/t | |
| 71 mg/km/t | +19.00 mg/km/t | |
| 72 mg/km/t | +20.00 mg/km/t | |
| 74 mg/km/t | +22.00 mg/km/t | |
| 77 mg/km/t | +25.00 mg/km/t | |
| 88 mg/km/t | +36.00 mg/km/t | |
| 88 mg/km/t | +36.00 mg/km/t | |
| 92 mg/km/t | +40.00 mg/km/t |
The difference between best and worst was 76.9% (40 mg/km/t).
Tire Reviews All Season Tire Tests
Results
Goodyear Vector 4Seasons Gen 3
205/55 R16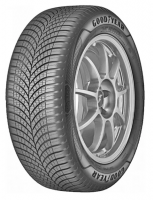
Category scores (% of best)
All discipline results (13)
Discipline positions compare the ranked tires in this test, not the whole market. These are individual measurements, not weighted overall scores.
| Test | Position in discipline | Result | Gap to best |
|---|---|---|---|
| Dry BrakingLower is better | 5th / 16 | 142 ft | +12 ft |
| Wet BrakingLower is better | 4th / 16 | 114 ft | +5 ft |
| Wet Braking - ConcreteLower is better | 4th / 16 | 131 ft | +8 ft |
| Straight AquaHigher is better | 5th / 16 | 49.3 mph | -1.8 mph |
| Curved AquaplaningHigher is better | 2nd / 16 | 11.2 ft/s² | -0.6 ft/s² |
| Snow BrakingLower is better | 5th / 16 | 35 ft | +2 ft |
| Snow TractionHigher is better | 5th / 16 | 49 lbf | -4 lbf |
| Ice BrakingLower is better | 4th / 16 | 61 ft | +2 ft |
| NoiseLower is better | 1st / 16 | 70.6 dB | Best in this discipline |
| Tire WeightLower is better | 2nd / 16 | 17.6 lb | +0.2 lb |
| WearHigher is better | 1st / 16 | 37,717 miles | Best in this discipline |
| Fuel ConsumptionLower is better | 8th / 16 | 5.4 l/100km | +0.20 l/100km |
| AbrasionLower is better | 4th / 16 | 57 mg/km/t | +5.00 mg/km/t |
- EU Label
- C/B/70
- 3PMSF
- Yes
Pirelli Cinturato All Season SF2
205/55 R16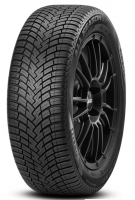
Category scores (% of best)
All discipline results (13)
Discipline positions compare the ranked tires in this test, not the whole market. These are individual measurements, not weighted overall scores.
| Test | Position in discipline | Result | Gap to best |
|---|---|---|---|
| Dry BrakingLower is better | 2nd / 16 | 133 ft | +3 ft |
| Wet BrakingLower is better | 1st / 16 | 109 ft | Best in this discipline |
| Wet Braking - ConcreteLower is better | 1st / 16 | 123 ft | Best in this discipline |
| Straight AquaHigher is better | 2nd / 16 | 50.3 mph | -0.8 mph |
| Curved AquaplaningHigher is better | 4th / 16 | 10.8 ft/s² | -1.0 ft/s² |
| Snow BrakingLower is better | 16th / 16 | 39 ft | +6 ft |
| Snow TractionHigher is better | 13th / 16 | 47 lbf | -6 lbf |
| Ice BrakingLower is better | 1st / 16 | 59 ft | Best in this discipline |
| NoiseLower is better | 1st / 16 | 70.6 dB | Best in this discipline |
| Tire WeightLower is better | 13th / 16 | 20.1 lb | +2.7 lb |
| WearHigher is better | 16th / 16 | 20,505 miles | -17,212 miles |
| Fuel ConsumptionLower is better | 8th / 16 | 5.4 l/100km | +0.20 l/100km |
| AbrasionLower is better | 11th / 16 | 72 mg/km/t | +20.00 mg/km/t |
- EU Label
- C/A/68
- 3PMSF
- Yes
Hankook Kinergy 4S2
205/55 R16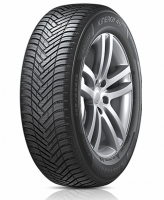
Category scores (% of best)
All discipline results (13)
Discipline positions compare the ranked tires in this test, not the whole market. These are individual measurements, not weighted overall scores.
| Test | Position in discipline | Result | Gap to best |
|---|---|---|---|
| Dry BrakingLower is better | 4th / 16 | 140 ft | +10 ft |
| Wet BrakingLower is better | 10th / 16 | 118 ft | +9 ft |
| Wet Braking - ConcreteLower is better | 11th / 16 | 139 ft | +16 ft |
| Straight AquaHigher is better | 11th / 16 | 48.3 mph | -2.8 mph |
| Curved AquaplaningHigher is better | 4th / 16 | 10.8 ft/s² | -1.0 ft/s² |
| Snow BrakingLower is better | 9th / 16 | 37 ft | +4 ft |
| Snow TractionHigher is better | 8th / 16 | 49 lbf | -4 lbf |
| Ice BrakingLower is better | 13th / 16 | 69 ft | +10 ft |
| NoiseLower is better | 14th / 16 | 72.1 dB | +1.50 dB |
| Tire WeightLower is better | 9th / 16 | 18.7 lb | +1.3 lb |
| WearHigher is better | 2nd / 16 | 32,001 miles | -5,716 miles |
| Fuel ConsumptionLower is better | 8th / 16 | 5.4 l/100km | +0.20 l/100km |
| AbrasionLower is better | 2nd / 16 | 56 mg/km/t | +4.00 mg/km/t |
- EU Label
- C/B/72
- 3PMSF
- Yes
Michelin CrossClimate 2
205/55 R16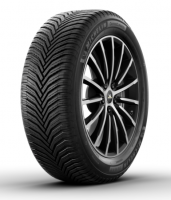
Category scores (% of best)
All discipline results (13)
Discipline positions compare the ranked tires in this test, not the whole market. These are individual measurements, not weighted overall scores.
| Test | Position in discipline | Result | Gap to best |
|---|---|---|---|
| Dry BrakingLower is better | 1st / 16 | 130 ft | Best in this discipline |
| Wet BrakingLower is better | 5th / 16 | 114 ft | +5 ft |
| Wet Braking - ConcreteLower is better | 9th / 16 | 135 ft | +12 ft |
| Straight AquaHigher is better | 2nd / 16 | 50.3 mph | -0.8 mph |
| Curved AquaplaningHigher is better | 9th / 16 | 10.5 ft/s² | -1.3 ft/s² |
| Snow BrakingLower is better | 8th / 16 | 36 ft | +3 ft |
| Snow TractionHigher is better | 3rd / 16 | 51 lbf | -2 lbf |
| Ice BrakingLower is better | 10th / 16 | 65 ft | +6 ft |
| NoiseLower is better | 4th / 16 | 71.1 dB | +0.50 dB |
| Tire WeightLower is better | 6th / 16 | 18.3 lb | +0.9 lb |
| WearHigher is better | 8th / 16 | 27,340 miles | -10,377 miles |
| Fuel ConsumptionLower is better | 4th / 16 | 5.3 l/100km | +0.10 l/100km |
| AbrasionLower is better | 1st / 16 | 52 mg/km/t | Best in this discipline |
- EU Label
- B/B/69
- 3PMSF
- Yes
Kumho Solus 4S HA32+
205/55 R16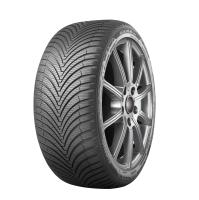
Category scores (% of best)
All discipline results (13)
Discipline positions compare the ranked tires in this test, not the whole market. These are individual measurements, not weighted overall scores.
| Test | Position in discipline | Result | Gap to best |
|---|---|---|---|
| Dry BrakingLower is better | 7th / 16 | 145 ft | +15 ft |
| Wet BrakingLower is better | 8th / 16 | 115 ft | +6 ft |
| Wet Braking - ConcreteLower is better | 7th / 16 | 133 ft | +10 ft |
| Straight AquaHigher is better | 14th / 16 | 45.6 mph | -5.5 mph |
| Curved AquaplaningHigher is better | 14th / 16 | 8.5 ft/s² | -3.3 ft/s² |
| Snow BrakingLower is better | 4th / 16 | 35 ft | +2 ft |
| Snow TractionHigher is better | 4th / 16 | 50 lbf | -3 lbf |
| Ice BrakingLower is better | 7th / 16 | 64 ft | +5 ft |
| NoiseLower is better | 12th / 16 | 71.9 dB | +1.30 dB |
| Tire WeightLower is better | 12th / 16 | 19.6 lb | +2.2 lb |
| WearHigher is better | 3rd / 16 | 31,441 miles | -6,276 miles |
| Fuel ConsumptionLower is better | 8th / 16 | 5.4 l/100km | +0.20 l/100km |
| AbrasionLower is better | 9th / 16 | 69 mg/km/t | +17.00 mg/km/t |
- EU Label
- C/B/72
- 3PMSF
- Yes
Vredestein Quatrac
205/55 R16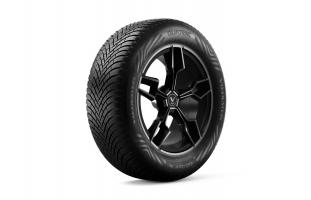
Category scores (% of best)
All discipline results (13)
Discipline positions compare the ranked tires in this test, not the whole market. These are individual measurements, not weighted overall scores.
| Test | Position in discipline | Result | Gap to best |
|---|---|---|---|
| Dry BrakingLower is better | 3rd / 16 | 138 ft | +8 ft |
| Wet BrakingLower is better | 6th / 16 | 115 ft | +6 ft |
| Wet Braking - ConcreteLower is better | 4th / 16 | 131 ft | +8 ft |
| Straight AquaHigher is better | 6th / 16 | 48.9 mph | -2.2 mph |
| Curved AquaplaningHigher is better | 4th / 16 | 10.8 ft/s² | -1.0 ft/s² |
| Snow BrakingLower is better | 13th / 16 | 38 ft | +5 ft |
| Snow TractionHigher is better | 6th / 16 | 49 lbf | -4 lbf |
| Ice BrakingLower is better | 11th / 16 | 67 ft | +8 ft |
| NoiseLower is better | 4th / 16 | 71.1 dB | +0.50 dB |
| Tire WeightLower is better | 5th / 16 | 18.1 lb | +0.7 lb |
| WearHigher is better | 5th / 16 | 29,826 miles | -7,891 miles |
| Fuel ConsumptionLower is better | 1st / 16 | 5.2 l/100km | Best in this discipline |
| AbrasionLower is better | 7th / 16 | 60 mg/km/t | +8.00 mg/km/t |
- EU Label
- C/B/70
- 3PMSF
- Yes
Falken EUROALL SEASON AS210
205/55 R16
Category scores (% of best)
All discipline results (13)
Discipline positions compare the ranked tires in this test, not the whole market. These are individual measurements, not weighted overall scores.
| Test | Position in discipline | Result | Gap to best |
|---|---|---|---|
| Dry BrakingLower is better | 7th / 16 | 145 ft | +15 ft |
| Wet BrakingLower is better | 3rd / 16 | 113 ft | +4 ft |
| Wet Braking - ConcreteLower is better | 2nd / 16 | 128 ft | +5 ft |
| Straight AquaHigher is better | 4th / 16 | 50.2 mph | -0.9 mph |
| Curved AquaplaningHigher is better | 2nd / 16 | 11.2 ft/s² | -0.6 ft/s² |
| Snow BrakingLower is better | 9th / 16 | 37 ft | +4 ft |
| Snow TractionHigher is better | 14th / 16 | 45 lbf | -8 lbf |
| Ice BrakingLower is better | 12th / 16 | 67 ft | +8 ft |
| NoiseLower is better | 16th / 16 | 72.3 dB | +1.70 dB |
| Tire WeightLower is better | 11th / 16 | 19.4 lb | +2.0 lb |
| WearHigher is better | 12th / 16 | 24,855 miles | -12,862 miles |
| Fuel ConsumptionLower is better | 8th / 16 | 5.4 l/100km | +0.20 l/100km |
| AbrasionLower is better | 12th / 16 | 74 mg/km/t | +22.00 mg/km/t |
- EU Label
- C/B/70
- 3PMSF
- Yes
Firestone MultiSeason Gen 02
205/55 R16
Category scores (% of best)
All discipline results (13)
Discipline positions compare the ranked tires in this test, not the whole market. These are individual measurements, not weighted overall scores.
| Test | Position in discipline | Result | Gap to best |
|---|---|---|---|
| Dry BrakingLower is better | 9th / 16 | 145 ft | +15 ft |
| Wet BrakingLower is better | 2nd / 16 | 110 ft | +1 ft |
| Wet Braking - ConcreteLower is better | 3rd / 16 | 129 ft | +6 ft |
| Straight AquaHigher is better | 9th / 16 | 48.3 mph | -2.8 mph |
| Curved AquaplaningHigher is better | 12th / 16 | 9.2 ft/s² | -2.6 ft/s² |
| Snow BrakingLower is better | 9th / 16 | 37 ft | +4 ft |
| Snow TractionHigher is better | 12th / 16 | 47 lbf | -6 lbf |
| Ice BrakingLower is better | 7th / 16 | 64 ft | +5 ft |
| NoiseLower is better | 10th / 16 | 71.5 dB | +0.90 dB |
| Tire WeightLower is better | 7th / 16 | 18.5 lb | +1.1 lb |
| WearHigher is better | 14th / 16 | 22,121 miles | -15,596 miles |
| Fuel ConsumptionLower is better | 4th / 16 | 5.3 l/100km | +0.10 l/100km |
| AbrasionLower is better | 14th / 16 | 88 mg/km/t | +36.00 mg/km/t |
- EU Label
- C/B/71
- 3PMSF
- Yes
Sava Sava All Weather
205/55 R16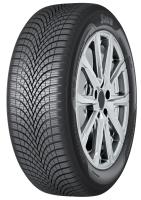
Category scores (% of best)
All discipline results (13)
Discipline positions compare the ranked tires in this test, not the whole market. These are individual measurements, not weighted overall scores.
| Test | Position in discipline | Result | Gap to best |
|---|---|---|---|
| Dry BrakingLower is better | 13th / 16 | 148 ft | +18 ft |
| Wet BrakingLower is better | 15th / 16 | 125 ft | +16 ft |
| Wet Braking - ConcreteLower is better | 15th / 16 | 146 ft | +23 ft |
| Straight AquaHigher is better | 13th / 16 | 46.0 mph | -5.1 mph |
| Curved AquaplaningHigher is better | 10th / 16 | 9.8 ft/s² | -2.0 ft/s² |
| Snow BrakingLower is better | 2nd / 16 | 34 ft | +1 ft |
| Snow TractionHigher is better | 1st / 16 | 53 lbf | Best in this discipline |
| Ice BrakingLower is better | 6th / 16 | 63 ft | +4 ft |
| NoiseLower is better | 6th / 16 | 71.4 dB | +0.80 dB |
| Tire WeightLower is better | 1st / 16 | 17.4 lb | Best in this discipline |
| WearHigher is better | 10th / 16 | 26,533 miles | -11,184 miles |
| Fuel ConsumptionLower is better | 1st / 16 | 5.2 l/100km | Best in this discipline |
| AbrasionLower is better | 8th / 16 | 63 mg/km/t | +11.00 mg/km/t |
- EU Label
- C/C/71
- 3PMSF
- Yes
Nankang Cross Seasons AW6
205/55 R16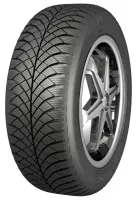
Category scores (% of best)
All discipline results (13)
Discipline positions compare the ranked tires in this test, not the whole market. These are individual measurements, not weighted overall scores.
| Test | Position in discipline | Result | Gap to best |
|---|---|---|---|
| Dry BrakingLower is better | 10th / 16 | 146 ft | +16 ft |
| Wet BrakingLower is better | 14th / 16 | 124 ft | +15 ft |
| Wet Braking - ConcreteLower is better | 14th / 16 | 144 ft | +21 ft |
| Straight AquaHigher is better | 15th / 16 | 44.9 mph | -6.2 mph |
| Curved AquaplaningHigher is better | 15th / 16 | 8.2 ft/s² | -3.6 ft/s² |
| Snow BrakingLower is better | 5th / 16 | 35 ft | +2 ft |
| Snow TractionHigher is better | 9th / 16 | 48 lbf | -5 lbf |
| Ice BrakingLower is better | 5th / 16 | 62 ft | +3 ft |
| NoiseLower is better | 1st / 16 | 70.6 dB | Best in this discipline |
| Tire WeightLower is better | 15th / 16 | 21.8 lb | +4.4 lb |
| WearHigher is better | 11th / 16 | 25,973 miles | -11,744 miles |
| Fuel ConsumptionLower is better | 4th / 16 | 5.3 l/100km | +0.10 l/100km |
| AbrasionLower is better | 13th / 16 | 77 mg/km/t | +25.00 mg/km/t |
- EU Label
- C/B/72
- 3PMSF
- Yes
Toyo Celsius AS2
205/55 R16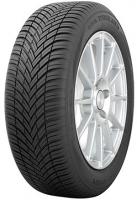
Category scores (% of best)
All discipline results (13)
Discipline positions compare the ranked tires in this test, not the whole market. These are individual measurements, not weighted overall scores.
| Test | Position in discipline | Result | Gap to best |
|---|---|---|---|
| Dry BrakingLower is better | 5th / 16 | 142 ft | +12 ft |
| Wet BrakingLower is better | 12th / 16 | 119 ft | +10 ft |
| Wet Braking - ConcreteLower is better | 12th / 16 | 141 ft | +18 ft |
| Straight AquaHigher is better | 8th / 16 | 48.7 mph | -2.4 mph |
| Curved AquaplaningHigher is better | 4th / 16 | 10.8 ft/s² | -1.0 ft/s² |
| Snow BrakingLower is better | 14th / 16 | 38 ft | +5 ft |
| Snow TractionHigher is better | 15th / 16 | 43 lbf | -10 lbf |
| Ice BrakingLower is better | 14th / 16 | 70 ft | +11 ft |
| NoiseLower is better | 10th / 16 | 71.5 dB | +0.90 dB |
| Tire WeightLower is better | 7th / 16 | 18.5 lb | +1.1 lb |
| WearHigher is better | 4th / 16 | 31,193 miles | -6,524 miles |
| Fuel ConsumptionLower is better | 14th / 16 | 5.41 l/100km | +0.21 l/100km |
| AbrasionLower is better | 5th / 16 | 59 mg/km/t | +7.00 mg/km/t |
- EU Label
- C/B/71
- 3PMSF
- Yes
Semperit AllSeason Grip
205/55 R16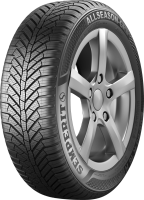
Category scores (% of best)
All discipline results (13)
Discipline positions compare the ranked tires in this test, not the whole market. These are individual measurements, not weighted overall scores.
| Test | Position in discipline | Result | Gap to best |
|---|---|---|---|
| Dry BrakingLower is better | 14th / 16 | 151 ft | +21 ft |
| Wet BrakingLower is better | 9th / 16 | 116 ft | +7 ft |
| Wet Braking - ConcreteLower is better | 6th / 16 | 132 ft | +9 ft |
| Straight AquaHigher is better | 9th / 16 | 48.3 mph | -2.8 mph |
| Curved AquaplaningHigher is better | 11th / 16 | 9.5 ft/s² | -2.3 ft/s² |
| Snow BrakingLower is better | 1st / 16 | 33 ft | Best in this discipline |
| Snow TractionHigher is better | 2nd / 16 | 51 lbf | -2 lbf |
| Ice BrakingLower is better | 2nd / 16 | 59 ft | 0 ft |
| NoiseLower is better | 6th / 16 | 71.4 dB | +0.80 dB |
| Tire WeightLower is better | 4th / 16 | 17.9 lb | +0.5 lb |
| WearHigher is better | 13th / 16 | 23,239 miles | -14,478 miles |
| Fuel ConsumptionLower is better | 8th / 16 | 5.4 l/100km | +0.20 l/100km |
| AbrasionLower is better | 14th / 16 | 88 mg/km/t | +36.00 mg/km/t |
- EU Label
- C/B/71
- 3PMSF
- Yes
Uniroyal AllSeasonExpert 2
205/55 R16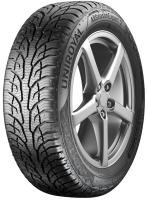
Category scores (% of best)
All discipline results (13)
Discipline positions compare the ranked tires in this test, not the whole market. These are individual measurements, not weighted overall scores.
| Test | Position in discipline | Result | Gap to best |
|---|---|---|---|
| Dry BrakingLower is better | 16th / 16 | 153 ft | +23 ft |
| Wet BrakingLower is better | 6th / 16 | 115 ft | +6 ft |
| Wet Braking - ConcreteLower is better | 8th / 16 | 134 ft | +11 ft |
| Straight AquaHigher is better | 1st / 16 | 51.1 mph | Best in this discipline |
| Curved AquaplaningHigher is better | 1st / 16 | 11.8 ft/s² | Best in this discipline |
| Snow BrakingLower is better | 5th / 16 | 35 ft | +2 ft |
| Snow TractionHigher is better | 6th / 16 | 49 lbf | -4 lbf |
| Ice BrakingLower is better | 3rd / 16 | 61 ft | +2 ft |
| NoiseLower is better | 6th / 16 | 71.4 dB | +0.80 dB |
| Tire WeightLower is better | 2nd / 16 | 17.6 lb | +0.2 lb |
| WearHigher is better | 5th / 16 | 29,826 miles | -7,891 miles |
| Fuel ConsumptionLower is better | 4th / 16 | 5.3 l/100km | +0.10 l/100km |
| AbrasionLower is better | 10th / 16 | 71 mg/km/t | +19.00 mg/km/t |
- EU Label
- C/B/72
- 3PMSF
- Yes
Yokohama BluEarth 4S AW21
205/55 R16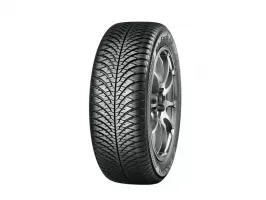
Category scores (% of best)
All discipline results (13)
Discipline positions compare the ranked tires in this test, not the whole market. These are individual measurements, not weighted overall scores.
| Test | Position in discipline | Result | Gap to best |
|---|---|---|---|
| Dry BrakingLower is better | 15th / 16 | 151 ft | +21 ft |
| Wet BrakingLower is better | 11th / 16 | 118 ft | +9 ft |
| Wet Braking - ConcreteLower is better | 10th / 16 | 135 ft | +12 ft |
| Straight AquaHigher is better | 12th / 16 | 46.5 mph | -4.6 mph |
| Curved AquaplaningHigher is better | 12th / 16 | 9.2 ft/s² | -2.6 ft/s² |
| Snow BrakingLower is better | 3rd / 16 | 34 ft | +1 ft |
| Snow TractionHigher is better | 10th / 16 | 48 lbf | -5 lbf |
| Ice BrakingLower is better | 14th / 16 | 70 ft | +11 ft |
| NoiseLower is better | 15th / 16 | 72.2 dB | +1.60 dB |
| Tire WeightLower is better | 16th / 16 | 22.3 lb | +4.9 lb |
| WearHigher is better | 15th / 16 | 21,064 miles | -16,653 miles |
| Fuel ConsumptionLower is better | 15th / 16 | 5.5 l/100km | +0.30 l/100km |
| AbrasionLower is better | 16th / 16 | 92 mg/km/t | +40.00 mg/km/t |
- EU Label
- D/B/72
- 3PMSF
- Yes
Kenda Kenetica 4S
205/55 R16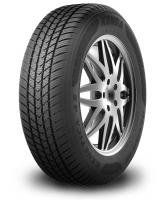
Category scores (% of best)
All discipline results (13)
Discipline positions compare the ranked tires in this test, not the whole market. These are individual measurements, not weighted overall scores.
| Test | Position in discipline | Result | Gap to best |
|---|---|---|---|
| Dry BrakingLower is better | 11th / 16 | 147 ft | +17 ft |
| Wet BrakingLower is better | 13th / 16 | 123 ft | +14 ft |
| Wet Braking - ConcreteLower is better | 13th / 16 | 142 ft | +19 ft |
| Straight AquaHigher is better | 7th / 16 | 48.8 mph | -2.3 mph |
| Curved AquaplaningHigher is better | 4th / 16 | 10.8 ft/s² | -1.0 ft/s² |
| Snow BrakingLower is better | 15th / 16 | 39 ft | +6 ft |
| Snow TractionHigher is better | 16th / 16 | 43 lbf | -10 lbf |
| Ice BrakingLower is better | 16th / 16 | 72 ft | +13 ft |
| NoiseLower is better | 12th / 16 | 71.9 dB | +1.30 dB |
| Tire WeightLower is better | 13th / 16 | 20.1 lb | +2.7 lb |
| WearHigher is better | 9th / 16 | 27,092 miles | -10,625 miles |
| Fuel ConsumptionLower is better | 15th / 16 | 5.5 l/100km | +0.30 l/100km |
| AbrasionLower is better | 5th / 16 | 59 mg/km/t | +7.00 mg/km/t |
- EU Label
- D/C/70
- 3PMSF
- Yes
Infinity Ecofour
205/55 R16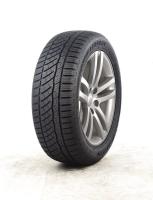
Category scores (% of best)
All discipline results (13)
Discipline positions compare the ranked tires in this test, not the whole market. These are individual measurements, not weighted overall scores.
| Test | Position in discipline | Result | Gap to best |
|---|---|---|---|
| Dry BrakingLower is better | 12th / 16 | 147 ft | +17 ft |
| Wet BrakingLower is better | 16th / 16 | 127 ft | +18 ft |
| Wet Braking - ConcreteLower is better | 16th / 16 | 151 ft | +28 ft |
| Straight AquaHigher is better | 16th / 16 | 43.1 mph | -8.0 mph |
| Curved AquaplaningHigher is better | 16th / 16 | 7.9 ft/s² | -3.9 ft/s² |
| Snow BrakingLower is better | 9th / 16 | 37 ft | +4 ft |
| Snow TractionHigher is better | 11th / 16 | 47 lbf | -6 lbf |
| Ice BrakingLower is better | 9th / 16 | 65 ft | +6 ft |
| NoiseLower is better | 6th / 16 | 71.4 dB | +0.80 dB |
| Tire WeightLower is better | 10th / 16 | 19.2 lb | +1.8 lb |
| WearHigher is better | 7th / 16 | 27,589 miles | -10,128 miles |
| Fuel ConsumptionLower is better | 1st / 16 | 5.2 l/100km | Best in this discipline |
| AbrasionLower is better | 2nd / 16 | 56 mg/km/t | +4.00 mg/km/t |
- EU Label
- C/C/72
- 3PMSF
- Yes
Those who want to buy tires should be able to determine some parameters according to themselves. The result should be calculated accordingly. For example, the last 5 parameters are not important to me. Why don't you have a result without those parameters?
This is the only site in the world you can do that for yourself on.