



ADAC has tested 16 winter tires in 185/65 R15, a common size for small cars such as the Skoda Fabia, VW Polo and Renault Clio. Each tire was graded for safety on dry, wet and wintry roads and for its environmental record, which covers wear, abrasion, efficiency and noise. Only two tires earned an overall "good", five were "satisfactory", and ADAC does not recommend the remaining nine.
The Continental WinterContact TS 870 wins with good grades on all three surfaces, and the Michelin Alpin 7 is the only other tire rated "good". It trails the Continental slightly on each surface but has no real weak spot. The Hankook Winter i*cept RS3 and Linglong Sport Master Winter share third, ahead of the Optimo Winter Touring OW41, Goodyear UltraGrip Performance 3 and GT Radial WinterPro2 Evo.
Test setup & methodology
The test setting, the conditions recorded and how the results contribute to the score.
Recorded test conditions
Recorded test conditions
- Dry Braking
- 62.1 → 0.0 mph
- Wet Braking
- 49.7 → 0.0 mph
- Wet Braking - Concrete
- 49.7 → 0.0 mph
- Snow Braking
- 18.6 → 0.0 mph
- Ice Braking
- 12.4 → 0.0 mph
Dry handling is what separates this test from most others. ADAC's testers found that around a third of the field lacked precision and stability on dry roads in this small size. Its grading rules let a weak dry score cap the overall result, so the Nokian Snowproof 2, Vredestein Wintrac, Barum Polaris 6, Kumho WinterCraft WP52+ and Viking WinTech NewGen were all marked down to "adequate", even though all five were rated good on wintry roads and most were good in the wet. The Bridgestone Blizzak LM005 finished level with them for a different reason. It was the best tire in the wet by a clear margin, but it has the shortest predicted mileage in the test and the highest abrasion, which pulled its environmental grade down to "adequate", and ADAC's rules carry that through to the overall grade. It was also imprecise on dry roads and weak in snow handling. ADAC also points out that Bridgestone still sells the older LM005 in this size rather than its current winter tire.
The Goodyear UltraGrip Performance 3 is the biggest surprise. It is normally one of the strongest winter tires in the tests we hold for it, and in our own 2023 winter tire test its subjective dry handling was among the best in the field. In this much smaller size, ADAC's testers found the rear axle slow to respond, so the Skoda needed constant steering corrections. The Goodyear was still good in the wet and on snow, so this looks specific to the size rather than a verdict on the tire in general.
ADAC ran a second winter test at the same time in 225/50 R17 on an Audi A4, and four tires appear in both: the Continental, Michelin, Goodyear and Hankook. The Continental is the most consistent, finishing first here and second in the larger size with an overall "good" in both. The Goodyear shows the biggest swing. In 225/50 R17 its dry handling was rated good, and its long predicted tread life gave it one of the best environmental scores in that test on the way to third place. In 185/65 R15 it drops to sixth, with a much weaker dry grade and only an average tread life. The Hankook's dry handling was also rated good in the larger size but only satisfactory here, while the Michelin moves the other way: its dry grade is better in this smaller size, and it climbs from fourth to second. All four tires have a noticeably shorter predicted tread life in this test than in the 17-inch one, though the two tests used different cars, so these figures are best compared within each test rather than between them.
At the bottom, the Sunny Winter-max NW611, Atlas Polarbear HP and Rockblade ROCK 868S were rated "poor" for their wet grip. The Rockblade is the most extreme case: it earned the best winter-surface grade in the whole test yet had the longest wet braking distances and the weakest aquaplaning resistance.
Dry
The Linglong Sport Master Winter stopped shortest on dry asphalt from 100 km/h, followed by the Kumho and the Goodyear. The Viking and Barum needed the most road. The dry braking spread was modest, however, and ADAC's dry grades mainly reflect the separate handling assessments at and below the limit, where the Continental and Michelin earned the best grades.
Dry Braking
Dry braking in feet (62 - 0 mph)
Lower is better ↓| Position / Tire | Result | Gap to best | Residual speed |
|---|---|---|---|
| 142 ft | Best | 0 mph | |
| 144 ft | +2 ft | 9 mph | |
| 145 ft | +3 ft | 11 mph | |
| 145 ft | +3 ft | 12 mph | |
| 145 ft | +3 ft | 12 mph | |
| 146 ft | +4 ft | 13 mph | |
| 146 ft | +4 ft | 13 mph | |
| 146 ft | +4 ft | 14 mph | |
| 147 ft | +5 ft | 15 mph | |
| 148 ft | +6 ft | 16 mph | |
| 148 ft | +6 ft | 16 mph | |
| 151 ft | +9 ft | 20 mph | |
| 152 ft | +10 ft | 20 mph | |
| 152 ft | +10 ft | 21 mph | |
| 156 ft | +14 ft | 24 mph | |
| 159 ft | +17 ft | 26 mph |
The difference between best and worst was 11.8% (17 ft ≈ 1.1 Car Lengths). From 80 mph, the Viking WinTech NewGen would still be travelling at 26 mph when the Linglong Sport Master Winter had stopped.
Residual speed is calculated from the measured braking distances, assuming constant deceleration; it is not a separate measurement.
Wet
The Bridgestone Blizzak LM005 was the best wet braker on both asphalt and concrete, with the Kumho second on both surfaces and the Continental third on asphalt. The three tires rated "poor" were far behind: the Sunny, Atlas and Rockblade needed much more distance than the rest of the field on both surfaces, and the Rockblade was the worst of all.
Wet Braking
Wet braking in feet (50 - 0 mph)
Lower is better ↓| Position / Tire | Result | Gap to best | Residual speed |
|---|---|---|---|
| 110 ft | Best | 0 mph | |
| 116 ft | +6 ft | 18 mph | |
| 118 ft | +8 ft | 21 mph | |
| 120 ft | +10 ft | 23 mph | |
| 122 ft | +12 ft | 25 mph | |
| 122 ft | +12 ft | 25 mph | |
| 122 ft | +12 ft | 25 mph | |
| 124 ft | +14 ft | 27 mph | |
| 126 ft | +16 ft | 29 mph | |
| 128 ft | +18 ft | 30 mph | |
| 128 ft | +18 ft | 30 mph | |
| 131 ft | +21 ft | 32 mph | |
| 131 ft | +21 ft | 32 mph | |
| 143 ft | +33 ft | 38 mph | |
| 160 ft | +50 ft | 45 mph | |
| 169 ft | +59 ft | 47 mph |
The difference between best and worst was 53.4% (59 ft ≈ 4 Car Lengths). From 80 mph, the Rockblade ROCK 868S would still be travelling at 47 mph when the Bridgestone Blizzak LM005 had stopped.
Residual speed is calculated from the measured braking distances, assuming constant deceleration; it is not a separate measurement.
Wet Braking - Concrete
Wet braking on Concrete in feet (50 - 0 mph)
Lower is better ↓| Position / Tire | Result | Gap to best | Residual speed |
|---|---|---|---|
| 121 ft | Best | 0 mph | |
| 128 ft | +7 ft | 19 mph | |
| 129 ft | +8 ft | 20 mph | |
| 129 ft | +8 ft | 20 mph | |
| 131 ft | +10 ft | 22 mph | |
| 132 ft | +11 ft | 23 mph | |
| 132 ft | +11 ft | 23 mph | |
| 132 ft | +11 ft | 23 mph | |
| 137 ft | +16 ft | 27 mph | |
| 138 ft | +17 ft | 28 mph | |
| 138 ft | +17 ft | 28 mph | |
| 145 ft | +24 ft | 32 mph | |
| 146 ft | +25 ft | 33 mph | |
| 159 ft | +38 ft | 39 mph | |
| 175 ft | +54 ft | 44 mph | |
| 184 ft | +63 ft | 47 mph |
The difference between best and worst was 51.8% (63 ft ≈ 4.2 Car Lengths). From 80 mph, the Rockblade ROCK 868S would still be travelling at 47 mph when the Bridgestone Blizzak LM005 had stopped.
Residual speed is calculated from the measured braking distances, assuming constant deceleration; it is not a separate measurement.
The Goodyear resisted straight-line aquaplaning best, ahead of the Bridgestone and Hankook, while the Bridgestone, Goodyear and Continental held the most grip in the curved aquaplaning test. The Rockblade floated earliest in both tests, with the Sunny next.
Straight Aqua
Float Speed in mph
Higher is better ↑| Position / Tire | Result | Gap to best |
|---|---|---|
| 61.3 mph | Best | |
| 60.4 mph | -0.9 mph | |
| 59.7 mph | -1.6 mph | |
| 59.1 mph | -2.2 mph | |
| 58.7 mph | -2.6 mph | |
| 58.1 mph | -3.2 mph | |
| 54.7 mph | -6.6 mph | |
| 54.2 mph | -7.1 mph | |
| 53.9 mph | -7.4 mph | |
| 53.5 mph | -7.8 mph | |
| 53.4 mph | -7.9 mph | |
| 53.4 mph | -7.9 mph | |
| 52.0 mph | -9.3 mph | |
| 48.6 mph | -12.7 mph | |
| 45.7 mph | -15.6 mph | |
| 41.9 mph | -19.4 mph |
The difference between best and worst was 31.6% (19.4 mph).
Curved Aquaplaning
Remaining lateral acceleration
Higher is better ↑| Position / Tire | Result | Gap to best |
|---|---|---|
| 14.4 ft/s² | Best | |
| 14.1 ft/s² | -0.3 ft/s² | |
| 13.5 ft/s² | -0.9 ft/s² | |
| 13.1 ft/s² | -1.3 ft/s² | |
| 12.8 ft/s² | -1.6 ft/s² | |
| 12.8 ft/s² | -1.6 ft/s² | |
| 11.5 ft/s² | -2.9 ft/s² | |
| 11.2 ft/s² | -3.2 ft/s² | |
| 10.8 ft/s² | -3.6 ft/s² | |
| 10.5 ft/s² | -3.9 ft/s² | |
| 10.5 ft/s² | -3.9 ft/s² | |
| 10.5 ft/s² | -3.9 ft/s² | |
| 9.8 ft/s² | -4.6 ft/s² | |
| 9.5 ft/s² | -4.9 ft/s² | |
| 7.2 ft/s² | -7.2 ft/s² | |
| 4.3 ft/s² | -10.1 ft/s² |
The difference between best and worst was 70.5% (10.1 ft/s²).
Snow
Snow braking was very close across the field. The Barum Polaris 6 stopped shortest, just ahead of the Goodyear, while the Atlas and Linglong needed the most distance. The Rockblade generated the most traction on packed snow, followed by the Barum and Viking. The Linglong had the least traction, and the Continental was also near the bottom on this measure, despite ADAC rating its snow handling above average. The traction figures below are ADAC's measured tractive force, converted to newtons.
Snow Braking
Snow braking in feet (19 - 0 mph)
Lower is better ↓| Position / Tire | Result | Gap to best | Residual speed |
|---|---|---|---|
| 33 ft | Best | 0 mph | |
| 33 ft | 0 ft | 8 mph | |
| 33 ft | 0 ft | 11 mph | |
| 33 ft | 0 ft | 11 mph | |
| 33 ft | 0 ft | 11 mph | |
| 33 ft | 0 ft | 11 mph | |
| 34 ft | +1 ft | 14 mph | |
| 34 ft | +1 ft | 16 mph | |
| 34 ft | +1 ft | 16 mph | |
| 34 ft | +1 ft | 17 mph | |
| 35 ft | +2 ft | 19 mph | |
| 35 ft | +2 ft | 20 mph | |
| 35 ft | +2 ft | 20 mph | |
| 35 ft | +2 ft | 20 mph | |
| 36 ft | +3 ft | 23 mph | |
| 36 ft | +3 ft | 24 mph |
The difference between best and worst was 10% (3 ft). From 80 mph, the Atlas Polarbear HP would still be travelling at 24 mph when the Barum Polaris 6 had stopped.
Residual speed is calculated from the measured braking distances, assuming constant deceleration; it is not a separate measurement.
Snow Traction
Pulling Force in pounds-force
Higher is better ↑| Position / Tire | Result | Gap to best |
|---|---|---|
| 666 lbf | Best | |
| 658 lbf | -8 lbf | |
| 653 lbf | -13 lbf | |
| 645 lbf | -21 lbf | |
| 641 lbf | -25 lbf | |
| 639 lbf | -27 lbf | |
| 638 lbf | -28 lbf | |
| 636 lbf | -30 lbf | |
| 635 lbf | -31 lbf | |
| 632 lbf | -34 lbf | |
| 631 lbf | -35 lbf | |
| 631 lbf | -35 lbf | |
| 629 lbf | -37 lbf | |
| 624 lbf | -42 lbf | |
| 623 lbf | -43 lbf | |
| 578 lbf | -88 lbf |
The difference between best and worst was 13.2% (88 lbf).

Ice
On polished ice the Rockblade stopped shortest, with the Viking and Michelin next. The Goodyear needed the most distance, followed by the Linglong.
Ice Braking
Ice braking in feet (12 - 0 mph)
Lower is better ↓| Position / Tire | Result | Gap to best | Residual speed |
|---|---|---|---|
| 64 ft | Best | 0 mph | |
| 64 ft | 0 ft | 8 mph | |
| 66 ft | +2 ft | 15 mph | |
| 66 ft | +2 ft | 16 mph | |
| 69 ft | +5 ft | 21 mph | |
| 69 ft | +5 ft | 22 mph | |
| 69 ft | +5 ft | 22 mph | |
| 70 ft | +6 ft | 23 mph | |
| 71 ft | +7 ft | 25 mph | |
| 71 ft | +7 ft | 25 mph | |
| 71 ft | +7 ft | 25 mph | |
| 72 ft | +8 ft | 27 mph | |
| 72 ft | +8 ft | 28 mph | |
| 72 ft | +8 ft | 28 mph | |
| 73 ft | +9 ft | 29 mph | |
| 74 ft | +10 ft | 30 mph |
The difference between best and worst was 16.5% (10 ft ≈ 0.7 Car Lengths). From 80 mph, the Goodyear UltraGrip Performance 3 would still be travelling at 30 mph when the Rockblade ROCK 868S had stopped.
Residual speed is calculated from the measured braking distances, assuming constant deceleration; it is not a separate measurement.
Noise
The Barum was the quietest tire in ADAC's pass-by noise measurement, ahead of the Viking and Goodyear. The Kumho was the loudest, followed by the Bridgestone.
Noise
External noise in dB
Lower is better ↓| Position / Tire | Result | Gap to best |
|---|---|---|
| 69.9 dB | Best | |
| 70.2 dB | +0.30 dB | |
| 70.5 dB | +0.60 dB | |
| 71.2 dB | +1.30 dB | |
| 71.3 dB | +1.40 dB | |
| 71.5 dB | +1.60 dB | |
| 71.5 dB | +1.60 dB | |
| 71.5 dB | +1.60 dB | |
| 71.6 dB | +1.70 dB | |
| 72.1 dB | +2.20 dB | |
| 72.3 dB | +2.40 dB | |
| 72.3 dB | +2.40 dB | |
| 72.4 dB | +2.50 dB | |
| 72.5 dB | +2.60 dB | |
| 72.9 dB | +3.00 dB | |
| 73.1 dB | +3.20 dB |
The difference between best and worst was 4.6% (3.2 dB).
Wear, economy and environment
ADAC notes that none of these tires is a high-mileage option. The Kumho has the longest predicted tread life, followed by the Atlas and Sunny, and the Bridgestone has by far the shortest. The Atlas and Rockblade shed the least rubber, while the Bridgestone, Viking and Optimo shed the most. The Barum and Atlas returned the lowest fuel consumption, and the Linglong the highest.
Wear
Predicted tread life in KM
Higher is better ↑| Position / Tire | Result | Gap to best |
|---|---|---|
| 24,855 miles | Best | |
| 22,245 miles | -2,610 miles | |
| 21,934 miles | -2,921 miles | |
| 21,313 miles | -3,542 miles | |
| 20,567 miles | -4,288 miles | |
| 19,884 miles | -4,971 miles | |
| 19,076 miles | -5,779 miles | |
| 18,952 miles | -5,903 miles | |
| 18,517 miles | -6,338 miles | |
| 18,330 miles | -6,525 miles | |
| 18,020 miles | -6,835 miles | |
| 18,020 miles | -6,835 miles | |
| 17,585 miles | -7,270 miles | |
| 17,523 miles | -7,332 miles | |
| 16,963 miles | -7,892 miles | |
| 13,919 miles | -10,936 miles |
The difference between best and worst was 44% (10,936 miles).
Combining ADAC's price per tire with the predicted tread life gives a cost per 1,000 km of tread. On that measure the Kumho is the best value by a clear margin, thanks to its long tread life and low price, followed by the Sunny and Atlas. The Bridgestone is by far the most expensive to run, and the premium Continental, Goodyear and Michelin sit in the lower half. ADAC marks the prices for the Viking, Sunny, Atlas and Rockblade as not representative, so treat their figures with some caution.
Value
Euros/1000km based on cost/wear
Lower is better ↓| Position / Tire | Result | Gap to best |
|---|---|---|
| 1.18 Price/1000 | Best | |
| 1.3 Price/1000 | +0.12 Price/1000 | |
| 1.68 Price/1000 | +0.50 Price/1000 | |
| 1.74 Price/1000 | +0.56 Price/1000 | |
| 1.86 Price/1000 | +0.68 Price/1000 | |
| 2.02 Price/1000 | +0.84 Price/1000 | |
| 2.03 Price/1000 | +0.85 Price/1000 | |
| 2.07 Price/1000 | +0.89 Price/1000 | |
| 2.16 Price/1000 | +0.98 Price/1000 | |
| 2.19 Price/1000 | +1.01 Price/1000 | |
| 2.31 Price/1000 | +1.13 Price/1000 | |
| 2.33 Price/1000 | +1.15 Price/1000 | |
| 2.34 Price/1000 | +1.16 Price/1000 | |
| 2.42 Price/1000 | +1.24 Price/1000 | |
| 2.48 Price/1000 | +1.30 Price/1000 | |
| 3.26 Price/1000 | +2.08 Price/1000 |
The difference between best and worst was 176.3% (2.08 Price/1000).
Abrasion
Weight of Tire Wear Particles Lost (mg/km/t)
Lower is better ↓| Position / Tire | Result | Gap to best |
|---|---|---|
| 63 mg/km/t | Best | |
| 72 mg/km/t | +9.00 mg/km/t | |
| 73 mg/km/t | +10.00 mg/km/t | |
| 77 mg/km/t | +14.00 mg/km/t | |
| 79 mg/km/t | +16.00 mg/km/t | |
| 82 mg/km/t | +19.00 mg/km/t | |
| 82 mg/km/t | +19.00 mg/km/t | |
| 82 mg/km/t | +19.00 mg/km/t | |
| 87 mg/km/t | +24.00 mg/km/t | |
| 93 mg/km/t | +30.00 mg/km/t | |
| 95 mg/km/t | +32.00 mg/km/t | |
| 107 mg/km/t | +44.00 mg/km/t | |
| 108 mg/km/t | +45.00 mg/km/t | |
| 110 mg/km/t | +47.00 mg/km/t | |
| 113 mg/km/t | +50.00 mg/km/t | |
| 117 mg/km/t | +54.00 mg/km/t |
The difference between best and worst was 85.7% (54 mg/km/t).
Fuel Consumption
Fuel consumption in Liters per 100 km
Lower is better ↓| Position / Tire | Result | Gap to best | Extra fuel / year |
|---|---|---|---|
| 5.3 l/100km | Best | $0 | |
| 5.3 l/100km | Best | $0 | |
| 5.4 l/100km | +0.10 l/100km | $18 | |
| 5.4 l/100km | +0.10 l/100km | $18 | |
| 5.5 l/100km | +0.20 l/100km | $37 | |
| 5.5 l/100km | +0.20 l/100km | $37 | |
| 5.5 l/100km | +0.20 l/100km | $37 | |
| 5.5 l/100km | +0.20 l/100km | $37 | |
| 5.5 l/100km | +0.20 l/100km | $37 | |
| 5.5 l/100km | +0.20 l/100km | $37 | |
| 5.6 l/100km | +0.30 l/100km | $55 | |
| 5.6 l/100km | +0.30 l/100km | $55 | |
| 5.6 l/100km | +0.30 l/100km | $55 | |
| 5.6 l/100km | +0.30 l/100km | $55 | |
| 5.7 l/100km | +0.40 l/100km | $73 | |
| 5.8 l/100km | +0.50 l/100km | $92 |
The difference between best and worst was 9.4% (0.5 l/100km). Over 12,000 miles a year at $3.60/gal, the Linglong Sport Master Winter uses about 26 gal ($92) more fuel than the Barum Polaris 6.
Adjust the assumptions
Calculated estimates, not additional measurements. Use the controls to explore the assumptions.
Results
For a small car on winter roads, the Continental WinterContact TS 870 is the tire to buy from this test, with the Michelin Alpin 7 a close alternative. Drivers who mostly face wet roads and can accept their dry-road handling could also consider the Hankook, Optimo or Goodyear. ADAC publishes the full sub-grades for every tire, along with its detailed methodology, at adac.de.
Continental WinterContact TS 870
185/65 R15 88T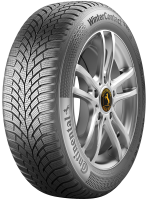
Category scores (% of best)
All discipline results (13)
Discipline positions compare the ranked tires in this test, not the whole market. These are individual measurements, not weighted overall scores.
| Test | Position in discipline | Result | Gap to best |
|---|---|---|---|
| Dry BrakingLower is better | 6th / 16 | 146 ft | +4 ft |
| Wet BrakingLower is better | 3rd / 16 | 118 ft | +8 ft |
| Wet Braking - ConcreteLower is better | 3rd / 16 | 129 ft | +8 ft |
| Straight AquaHigher is better | 4th / 16 | 59.1 mph | -2.2 mph |
| Curved AquaplaningHigher is better | 3rd / 16 | 13.5 ft/s² | -0.9 ft/s² |
| Snow BrakingLower is better | 8th / 16 | 34 ft | +1 ft |
| Snow TractionHigher is better | 15th / 16 | 623 lbf | -43 lbf |
| Ice BrakingLower is better | 9th / 16 | 71 ft | +7 ft |
| NoiseLower is better | 10th / 16 | 72.1 dB | +2.20 dB |
| WearHigher is better | 4th / 16 | 21,313 miles | -3,542 miles |
| ValueLower is better | 12th / 16 | 2.33 Price/1000 | +1.15 Price/1000 |
| Fuel ConsumptionLower is better | 5th / 16 | 5.5 l/100km | +0.20 l/100km |
| AbrasionLower is better | 6th / 16 | 82 mg/km/t | +19.00 mg/km/t |
- EU Label
- C/B/70
- Weight
- 7.0 kgs
- Price
- 80.00
Michelin Alpin 7
185/65 R15 88T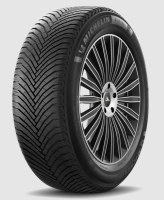
Category scores (% of best)
All discipline results (13)
Discipline positions compare the ranked tires in this test, not the whole market. These are individual measurements, not weighted overall scores.
| Test | Position in discipline | Result | Gap to best |
|---|---|---|---|
| Dry BrakingLower is better | 6th / 16 | 146 ft | +4 ft |
| Wet BrakingLower is better | 5th / 16 | 122 ft | +12 ft |
| Wet Braking - ConcreteLower is better | 3rd / 16 | 129 ft | +8 ft |
| Straight AquaHigher is better | 11th / 16 | 53.4 mph | -7.9 mph |
| Curved AquaplaningHigher is better | 7th / 16 | 11.5 ft/s² | -2.9 ft/s² |
| Snow BrakingLower is better | 10th / 16 | 34 ft | +1 ft |
| Snow TractionHigher is better | 5th / 16 | 641 lbf | -25 lbf |
| Ice BrakingLower is better | 3rd / 16 | 66 ft | +2 ft |
| NoiseLower is better | 11th / 16 | 72.3 dB | +2.40 dB |
| WearHigher is better | 5th / 16 | 20,567 miles | -4,288 miles |
| ValueLower is better | 14th / 16 | 2.42 Price/1000 | +1.24 Price/1000 |
| Fuel ConsumptionLower is better | 5th / 16 | 5.5 l/100km | +0.20 l/100km |
| AbrasionLower is better | 5th / 16 | 79 mg/km/t | +16.00 mg/km/t |
- EU Label
- C/B/69
- Weight
- 7.1 kgs
- Price
- 80.00
Hankook Winter I cept RS3
185/65 R15 88T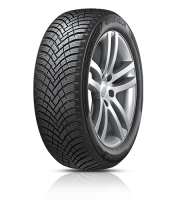
Category scores (% of best)
All discipline results (13)
Discipline positions compare the ranked tires in this test, not the whole market. These are individual measurements, not weighted overall scores.
| Test | Position in discipline | Result | Gap to best |
|---|---|---|---|
| Dry BrakingLower is better | 11th / 16 | 148 ft | +6 ft |
| Wet BrakingLower is better | 5th / 16 | 122 ft | +12 ft |
| Wet Braking - ConcreteLower is better | 7th / 16 | 132 ft | +11 ft |
| Straight AquaHigher is better | 3rd / 16 | 59.7 mph | -1.6 mph |
| Curved AquaplaningHigher is better | 4th / 16 | 13.1 ft/s² | -1.3 ft/s² |
| Snow BrakingLower is better | 12th / 16 | 35 ft | +2 ft |
| Snow TractionHigher is better | 10th / 16 | 632 lbf | -34 lbf |
| Ice BrakingLower is better | 13th / 16 | 72 ft | +8 ft |
| NoiseLower is better | 14th / 16 | 72.5 dB | +2.60 dB |
| WearHigher is better | 15th / 16 | 16,963 miles | -7,892 miles |
| ValueLower is better | 11th / 16 | 2.31 Price/1000 | +1.13 Price/1000 |
| Fuel ConsumptionLower is better | 15th / 16 | 5.7 l/100km | +0.40 l/100km |
| AbrasionLower is better | 10th / 16 | 93 mg/km/t | +30.00 mg/km/t |
- EU Label
- D/B/71
- Weight
- 7.2 kgs
- Price
- 63.00
Linglong Sport Master Winter
185/65 R15 88T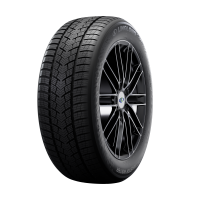
Category scores (% of best)
All discipline results (13)
Discipline positions compare the ranked tires in this test, not the whole market. These are individual measurements, not weighted overall scores.
| Test | Position in discipline | Result | Gap to best |
|---|---|---|---|
| Dry BrakingLower is better | 1st / 16 | 142 ft | Best in this discipline |
| Wet BrakingLower is better | 8th / 16 | 124 ft | +14 ft |
| Wet Braking - ConcreteLower is better | 7th / 16 | 132 ft | +11 ft |
| Straight AquaHigher is better | 13th / 16 | 52.0 mph | -9.3 mph |
| Curved AquaplaningHigher is better | 14th / 16 | 9.5 ft/s² | -4.9 ft/s² |
| Snow BrakingLower is better | 15th / 16 | 36 ft | +3 ft |
| Snow TractionHigher is better | 16th / 16 | 578 lbf | -88 lbf |
| Ice BrakingLower is better | 15th / 16 | 73 ft | +9 ft |
| NoiseLower is better | 9th / 16 | 71.6 dB | +1.70 dB |
| WearHigher is better | 11th / 16 | 18,020 miles | -6,835 miles |
| ValueLower is better | 5th / 16 | 1.86 Price/1000 | +0.68 Price/1000 |
| Fuel ConsumptionLower is better | 16th / 16 | 5.8 l/100km | +0.50 l/100km |
| AbrasionLower is better | 6th / 16 | 82 mg/km/t | +19.00 mg/km/t |
- EU Label
- D/B/71
- Weight
- 8.3 kgs
- Price
- 54.00
Optimo Winter Touring
185/65 R15 88T
Category scores (% of best)
All discipline results (13)
Discipline positions compare the ranked tires in this test, not the whole market. These are individual measurements, not weighted overall scores.
| Test | Position in discipline | Result | Gap to best |
|---|---|---|---|
| Dry BrakingLower is better | 8th / 16 | 146 ft | +4 ft |
| Wet BrakingLower is better | 11th / 16 | 128 ft | +18 ft |
| Wet Braking - ConcreteLower is better | 10th / 16 | 138 ft | +17 ft |
| Straight AquaHigher is better | 5th / 16 | 58.7 mph | -2.6 mph |
| Curved AquaplaningHigher is better | 5th / 16 | 12.8 ft/s² | -1.6 ft/s² |
| Snow BrakingLower is better | 12th / 16 | 35 ft | +2 ft |
| Snow TractionHigher is better | 6th / 16 | 639 lbf | -27 lbf |
| Ice BrakingLower is better | 9th / 16 | 71 ft | +7 ft |
| NoiseLower is better | 11th / 16 | 72.3 dB | +2.40 dB |
| WearHigher is better | 14th / 16 | 17,523 miles | -7,332 miles |
| ValueLower is better | 4th / 16 | 1.74 Price/1000 | +0.56 Price/1000 |
| Fuel ConsumptionLower is better | 11th / 16 | 5.6 l/100km | +0.30 l/100km |
| AbrasionLower is better | 14th / 16 | 110 mg/km/t | +47.00 mg/km/t |
- EU Label
- D/C/71
- Weight
- 7.7 kgs
- Price
- 49.00
Goodyear UltraGrip Performance 3
185/65 R15 88T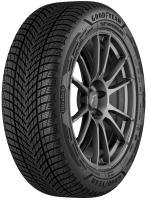
Category scores (% of best)
All discipline results (13)
Discipline positions compare the ranked tires in this test, not the whole market. These are individual measurements, not weighted overall scores.
| Test | Position in discipline | Result | Gap to best |
|---|---|---|---|
| Dry BrakingLower is better | 3rd / 16 | 145 ft | +3 ft |
| Wet BrakingLower is better | 4th / 16 | 120 ft | +10 ft |
| Wet Braking - ConcreteLower is better | 6th / 16 | 132 ft | +11 ft |
| Straight AquaHigher is better | 1st / 16 | 61.3 mph | Best in this discipline |
| Curved AquaplaningHigher is better | 2nd / 16 | 14.1 ft/s² | -0.3 ft/s² |
| Snow BrakingLower is better | 2nd / 16 | 33 ft | 0 ft |
| Snow TractionHigher is better | 13th / 16 | 629 lbf | -37 lbf |
| Ice BrakingLower is better | 16th / 16 | 74 ft | +10 ft |
| NoiseLower is better | 3rd / 16 | 70.5 dB | +0.60 dB |
| WearHigher is better | 6th / 16 | 19,884 miles | -4,971 miles |
| ValueLower is better | 13th / 16 | 2.34 Price/1000 | +1.16 Price/1000 |
| Fuel ConsumptionLower is better | 5th / 16 | 5.5 l/100km | +0.20 l/100km |
| AbrasionLower is better | 4th / 16 | 77 mg/km/t | +14.00 mg/km/t |
- EU Label
- D/B/71
- Weight
- 7.0 kgs
- Price
- 75.00
GT Radial WinterPro2 Evo
185/65 R15 88T
Category scores (% of best)
All discipline results (13)
Discipline positions compare the ranked tires in this test, not the whole market. These are individual measurements, not weighted overall scores.
| Test | Position in discipline | Result | Gap to best |
|---|---|---|---|
| Dry BrakingLower is better | 4th / 16 | 145 ft | +3 ft |
| Wet BrakingLower is better | 10th / 16 | 128 ft | +18 ft |
| Wet Braking - ConcreteLower is better | 11th / 16 | 138 ft | +17 ft |
| Straight AquaHigher is better | 10th / 16 | 53.5 mph | -7.8 mph |
| Curved AquaplaningHigher is better | 10th / 16 | 10.5 ft/s² | -3.9 ft/s² |
| Snow BrakingLower is better | 8th / 16 | 34 ft | +1 ft |
| Snow TractionHigher is better | 11th / 16 | 631 lbf | -35 lbf |
| Ice BrakingLower is better | 6th / 16 | 69 ft | +5 ft |
| NoiseLower is better | 6th / 16 | 71.5 dB | +1.60 dB |
| WearHigher is better | 9th / 16 | 18,517 miles | -6,338 miles |
| ValueLower is better | 15th / 16 | 2.48 Price/1000 | +1.30 Price/1000 |
| Fuel ConsumptionLower is better | 11th / 16 | 5.6 l/100km | +0.30 l/100km |
| AbrasionLower is better | 12th / 16 | 107 mg/km/t | +44.00 mg/km/t |
- EU Label
- D/B/69
- Weight
- 8.0 kgs
- Price
- 74.00
Bridgestone Blizzak LM005
185/65 R15 88T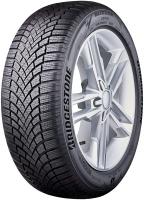
Category scores (% of best)
All discipline results (13)
Discipline positions compare the ranked tires in this test, not the whole market. These are individual measurements, not weighted overall scores.
| Test | Position in discipline | Result | Gap to best |
|---|---|---|---|
| Dry BrakingLower is better | 10th / 16 | 148 ft | +6 ft |
| Wet BrakingLower is better | 1st / 16 | 110 ft | Best in this discipline |
| Wet Braking - ConcreteLower is better | 1st / 16 | 121 ft | Best in this discipline |
| Straight AquaHigher is better | 2nd / 16 | 60.4 mph | -0.9 mph |
| Curved AquaplaningHigher is better | 1st / 16 | 14.4 ft/s² | Best in this discipline |
| Snow BrakingLower is better | 12th / 16 | 35 ft | +2 ft |
| Snow TractionHigher is better | 8th / 16 | 636 lbf | -30 lbf |
| Ice BrakingLower is better | 13th / 16 | 72 ft | +8 ft |
| NoiseLower is better | 15th / 16 | 72.9 dB | +3.00 dB |
| WearHigher is better | 16th / 16 | 13,919 miles | -10,936 miles |
| ValueLower is better | 16th / 16 | 3.26 Price/1000 | +2.08 Price/1000 |
| Fuel ConsumptionLower is better | 5th / 16 | 5.5 l/100km | +0.20 l/100km |
| AbrasionLower is better | 16th / 16 | 117 mg/km/t | +54.00 mg/km/t |
- EU Label
- C/A/71
- Weight
- 7.5 kgs
- Price
- 73.00
Nokian Snowproof 2
185/65 R15 88T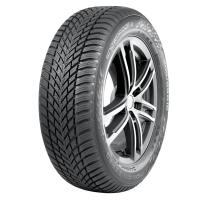
Category scores (% of best)
All discipline results (13)
Discipline positions compare the ranked tires in this test, not the whole market. These are individual measurements, not weighted overall scores.
| Test | Position in discipline | Result | Gap to best |
|---|---|---|---|
| Dry BrakingLower is better | 4th / 16 | 145 ft | +3 ft |
| Wet BrakingLower is better | 9th / 16 | 126 ft | +16 ft |
| Wet Braking - ConcreteLower is better | 9th / 16 | 137 ft | +16 ft |
| Straight AquaHigher is better | 6th / 16 | 58.1 mph | -3.2 mph |
| Curved AquaplaningHigher is better | 5th / 16 | 12.8 ft/s² | -1.6 ft/s² |
| Snow BrakingLower is better | 7th / 16 | 34 ft | +1 ft |
| Snow TractionHigher is better | 11th / 16 | 631 lbf | -35 lbf |
| Ice BrakingLower is better | 8th / 16 | 70 ft | +6 ft |
| NoiseLower is better | 13th / 16 | 72.4 dB | +2.50 dB |
| WearHigher is better | 7th / 16 | 19,076 miles | -5,779 miles |
| ValueLower is better | 6th / 16 | 2.02 Price/1000 | +0.84 Price/1000 |
| Fuel ConsumptionLower is better | 3rd / 16 | 5.4 l/100km | +0.10 l/100km |
| AbrasionLower is better | 9th / 16 | 87 mg/km/t | +24.00 mg/km/t |
- EU Label
- C/B/68
- Weight
- 7.0 kgs
- Price
- 62.00
Vredestein Wintrac
185/65 R15 88H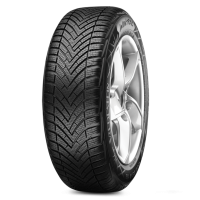
Category scores (% of best)
All discipline results (13)
Discipline positions compare the ranked tires in this test, not the whole market. These are individual measurements, not weighted overall scores.
| Test | Position in discipline | Result | Gap to best |
|---|---|---|---|
| Dry BrakingLower is better | 9th / 16 | 147 ft | +5 ft |
| Wet BrakingLower is better | 5th / 16 | 122 ft | +12 ft |
| Wet Braking - ConcreteLower is better | 5th / 16 | 131 ft | +10 ft |
| Straight AquaHigher is better | 7th / 16 | 54.7 mph | -6.6 mph |
| Curved AquaplaningHigher is better | 10th / 16 | 10.5 ft/s² | -3.9 ft/s² |
| Snow BrakingLower is better | 11th / 16 | 35 ft | +2 ft |
| Snow TractionHigher is better | 9th / 16 | 635 lbf | -31 lbf |
| Ice BrakingLower is better | 6th / 16 | 69 ft | +5 ft |
| NoiseLower is better | 4th / 16 | 71.2 dB | +1.30 dB |
| WearHigher is better | 13th / 16 | 17,585 miles | -7,270 miles |
| ValueLower is better | 10th / 16 | 2.19 Price/1000 | +1.01 Price/1000 |
| Fuel ConsumptionLower is better | 11th / 16 | 5.6 l/100km | +0.30 l/100km |
| AbrasionLower is better | 3rd / 16 | 73 mg/km/t | +10.00 mg/km/t |
- EU Label
- C/B/69
- Weight
- 7.2 kgs
- Price
- 62.00
Barum Polaris 6
185/65 R15 88T
Category scores (% of best)
All discipline results (13)
Discipline positions compare the ranked tires in this test, not the whole market. These are individual measurements, not weighted overall scores.
| Test | Position in discipline | Result | Gap to best |
|---|---|---|---|
| Dry BrakingLower is better | 15th / 16 | 156 ft | +14 ft |
| Wet BrakingLower is better | 12th / 16 | 131 ft | +21 ft |
| Wet Braking - ConcreteLower is better | 13th / 16 | 146 ft | +25 ft |
| Straight AquaHigher is better | 11th / 16 | 53.4 mph | -7.9 mph |
| Curved AquaplaningHigher is better | 9th / 16 | 10.8 ft/s² | -3.6 ft/s² |
| Snow BrakingLower is better | 1st / 16 | 33 ft | Best in this discipline |
| Snow TractionHigher is better | 2nd / 16 | 658 lbf | -8 lbf |
| Ice BrakingLower is better | 4th / 16 | 66 ft | +2 ft |
| NoiseLower is better | 1st / 16 | 69.9 dB | Best in this discipline |
| WearHigher is better | 11th / 16 | 18,020 miles | -6,835 miles |
| ValueLower is better | 7th / 16 | 2.03 Price/1000 | +0.85 Price/1000 |
| Fuel ConsumptionLower is better | 1st / 16 | 5.3 l/100km | Best in this discipline |
| AbrasionLower is better | 13th / 16 | 108 mg/km/t | +45.00 mg/km/t |
- EU Label
- B/C/71
- Weight
- 7.7 kgs
- Price
- 59.00
Kumho WinterCraft WP52+
185/65 R15 88T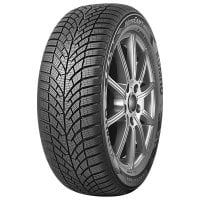
Category scores (% of best)
All discipline results (13)
Discipline positions compare the ranked tires in this test, not the whole market. These are individual measurements, not weighted overall scores.
| Test | Position in discipline | Result | Gap to best |
|---|---|---|---|
| Dry BrakingLower is better | 2nd / 16 | 144 ft | +2 ft |
| Wet BrakingLower is better | 2nd / 16 | 116 ft | +6 ft |
| Wet Braking - ConcreteLower is better | 2nd / 16 | 128 ft | +7 ft |
| Straight AquaHigher is better | 8th / 16 | 54.2 mph | -7.1 mph |
| Curved AquaplaningHigher is better | 10th / 16 | 10.5 ft/s² | -3.9 ft/s² |
| Snow BrakingLower is better | 3rd / 16 | 33 ft | 0 ft |
| Snow TractionHigher is better | 4th / 16 | 645 lbf | -21 lbf |
| Ice BrakingLower is better | 9th / 16 | 71 ft | +7 ft |
| NoiseLower is better | 16th / 16 | 73.1 dB | +3.20 dB |
| WearHigher is better | 1st / 16 | 24,855 miles | Best in this discipline |
| ValueLower is better | 1st / 16 | 1.18 Price/1000 | Best in this discipline |
| Fuel ConsumptionLower is better | 11th / 16 | 5.6 l/100km | +0.30 l/100km |
| AbrasionLower is better | 11th / 16 | 95 mg/km/t | +32.00 mg/km/t |
- EU Label
- D/B/71
- Weight
- 7.7 kgs
- Price
- 47.00
Viking WinTech NewGen
185/65 R15 88T
Category scores (% of best)
All discipline results (13)
Discipline positions compare the ranked tires in this test, not the whole market. These are individual measurements, not weighted overall scores.
| Test | Position in discipline | Result | Gap to best |
|---|---|---|---|
| Dry BrakingLower is better | 16th / 16 | 159 ft | +17 ft |
| Wet BrakingLower is better | 12th / 16 | 131 ft | +21 ft |
| Wet Braking - ConcreteLower is better | 12th / 16 | 145 ft | +24 ft |
| Straight AquaHigher is better | 9th / 16 | 53.9 mph | -7.4 mph |
| Curved AquaplaningHigher is better | 8th / 16 | 11.2 ft/s² | -3.2 ft/s² |
| Snow BrakingLower is better | 3rd / 16 | 33 ft | 0 ft |
| Snow TractionHigher is better | 3rd / 16 | 653 lbf | -13 lbf |
| Ice BrakingLower is better | 2nd / 16 | 64 ft | 0 ft |
| NoiseLower is better | 2nd / 16 | 70.2 dB | +0.30 dB |
| WearHigher is better | 10th / 16 | 18,330 miles | -6,525 miles |
| ValueLower is better | 8th / 16 | 2.07 Price/1000 | +0.89 Price/1000 |
| Fuel ConsumptionLower is better | 5th / 16 | 5.5 l/100km | +0.20 l/100km |
| AbrasionLower is better | 15th / 16 | 113 mg/km/t | +50.00 mg/km/t |
- EU Label
- B/C/71
- Weight
- 7.2 kgs
- Price
- 61.00
Sunny Wintermax NW611
185/65 R15 88T
Category scores (% of best)
All discipline results (13)
Discipline positions compare the ranked tires in this test, not the whole market. These are individual measurements, not weighted overall scores.
| Test | Position in discipline | Result | Gap to best |
|---|---|---|---|
| Dry BrakingLower is better | 13th / 16 | 152 ft | +10 ft |
| Wet BrakingLower is better | 14th / 16 | 143 ft | +33 ft |
| Wet Braking - ConcreteLower is better | 14th / 16 | 159 ft | +38 ft |
| Straight AquaHigher is better | 15th / 16 | 45.7 mph | -15.6 mph |
| Curved AquaplaningHigher is better | 15th / 16 | 7.2 ft/s² | -7.2 ft/s² |
| Snow BrakingLower is better | 3rd / 16 | 33 ft | 0 ft |
| Snow TractionHigher is better | 7th / 16 | 638 lbf | -28 lbf |
| Ice BrakingLower is better | 5th / 16 | 69 ft | +5 ft |
| NoiseLower is better | 6th / 16 | 71.5 dB | +1.60 dB |
| WearHigher is better | 3rd / 16 | 21,934 miles | -2,921 miles |
| ValueLower is better | 2nd / 16 | 1.3 Price/1000 | +0.12 Price/1000 |
| Fuel ConsumptionLower is better | 5th / 16 | 5.5 l/100km | +0.20 l/100km |
| AbrasionLower is better | 6th / 16 | 82 mg/km/t | +19.00 mg/km/t |
- EU Label
- C/C/71
- Weight
- 8.0 kgs
- Price
- 46.00
Atlas Polarbear HP
185/65 R15 88T
Category scores (% of best)
All discipline results (13)
Discipline positions compare the ranked tires in this test, not the whole market. These are individual measurements, not weighted overall scores.
| Test | Position in discipline | Result | Gap to best |
|---|---|---|---|
| Dry BrakingLower is better | 12th / 16 | 151 ft | +9 ft |
| Wet BrakingLower is better | 15th / 16 | 160 ft | +50 ft |
| Wet Braking - ConcreteLower is better | 15th / 16 | 175 ft | +54 ft |
| Straight AquaHigher is better | 14th / 16 | 48.6 mph | -12.7 mph |
| Curved AquaplaningHigher is better | 13th / 16 | 9.8 ft/s² | -4.6 ft/s² |
| Snow BrakingLower is better | 16th / 16 | 36 ft | +3 ft |
| Snow TractionHigher is better | 14th / 16 | 624 lbf | -42 lbf |
| Ice BrakingLower is better | 12th / 16 | 72 ft | +8 ft |
| NoiseLower is better | 6th / 16 | 71.5 dB | +1.60 dB |
| WearHigher is better | 2nd / 16 | 22,245 miles | -2,610 miles |
| ValueLower is better | 3rd / 16 | 1.68 Price/1000 | +0.50 Price/1000 |
| Fuel ConsumptionLower is better | 1st / 16 | 5.3 l/100km | Best in this discipline |
| AbrasionLower is better | 1st / 16 | 63 mg/km/t | Best in this discipline |
- EU Label
- C/C/68
- Weight
- 7.3 kgs
- Price
- 60.00
Rockblade ROCK 868S
185/65 R15 88H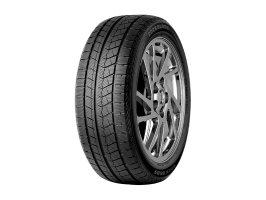
Category scores (% of best)
All discipline results (13)
Discipline positions compare the ranked tires in this test, not the whole market. These are individual measurements, not weighted overall scores.
| Test | Position in discipline | Result | Gap to best |
|---|---|---|---|
| Dry BrakingLower is better | 14th / 16 | 152 ft | +10 ft |
| Wet BrakingLower is better | 16th / 16 | 169 ft | +59 ft |
| Wet Braking - ConcreteLower is better | 16th / 16 | 184 ft | +63 ft |
| Straight AquaHigher is better | 16th / 16 | 41.9 mph | -19.4 mph |
| Curved AquaplaningHigher is better | 16th / 16 | 4.3 ft/s² | -10.1 ft/s² |
| Snow BrakingLower is better | 3rd / 16 | 33 ft | 0 ft |
| Snow TractionHigher is better | 1st / 16 | 666 lbf | Best in this discipline |
| Ice BrakingLower is better | 1st / 16 | 64 ft | Best in this discipline |
| NoiseLower is better | 5th / 16 | 71.3 dB | +1.40 dB |
| WearHigher is better | 8th / 16 | 18,952 miles | -5,903 miles |
| ValueLower is better | 9th / 16 | 2.16 Price/1000 | +0.98 Price/1000 |
| Fuel ConsumptionLower is better | 3rd / 16 | 5.4 l/100km | +0.10 l/100km |
| AbrasionLower is better | 2nd / 16 | 72 mg/km/t | +9.00 mg/km/t |
- EU Label
- D/C/69
- Weight
- 7.2 kgs
- Price
- 66.00

Discussion