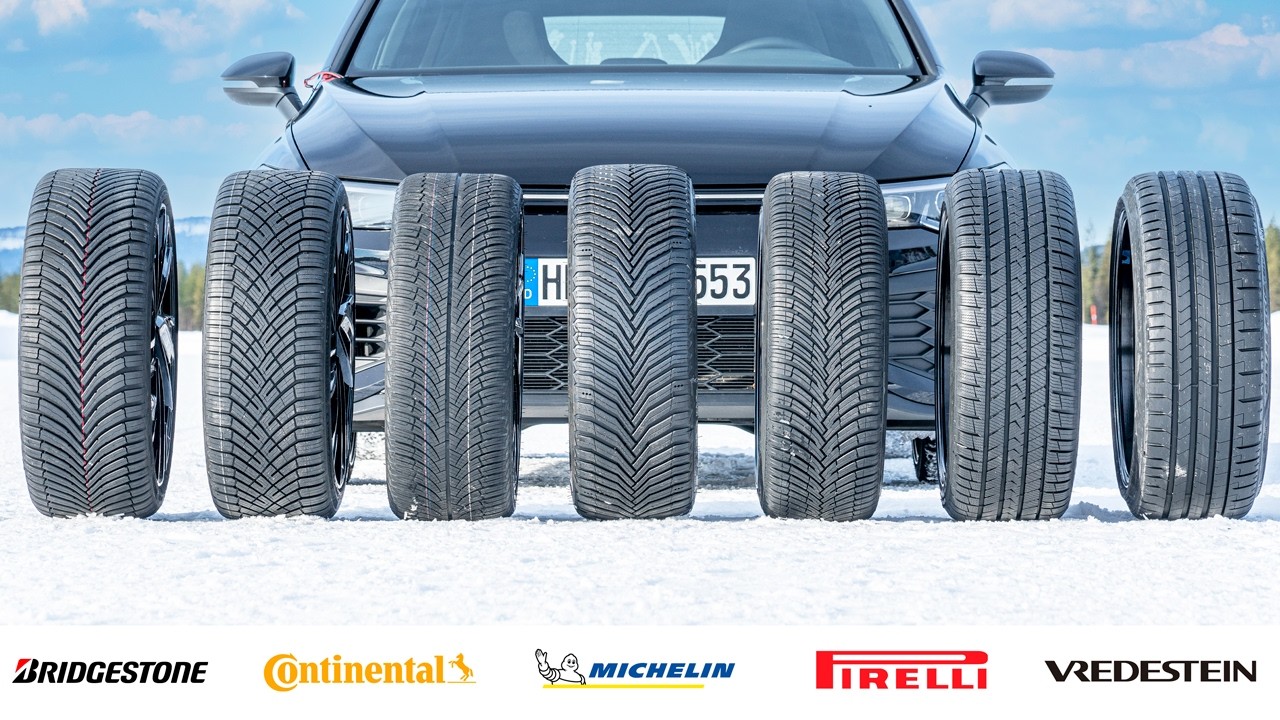
This is the 2024/25 Tire Reviews All Season Tire Test! For this test, I have selected six of the best all season tires in the large 235/35 R19 tire size, and I'm using a MK8 VW Golf GTI to find out exactly which all season tire is best in the larger wheel size.
To give this test extra depth, I also have six ultra high performance winter tires in exactly the same size, and I've included a summer tire. With this relatively small test field I've managed to test everything as one test, which means a common control allowing us to cross reference the data. This has shown us how the very best all season tires compare to the very best summer and winter tires in the snow, ice, dry and wet. There's some really interesting insight into how the all season tires compare to the other categories below.
Testing Methodology
Test Driver
Jonathan Benson
Tire Size
235/35 R19
Test Location
Professional Proving Ground
Test Year
2024
Tires Tested
6
Show full testing methodologyHide methodology
Every tire is tested using calibrated instrumented measurement and structured subjective assessment. Reference tires are retested throughout each session to correct for changing conditions, ensuring fair, repeatable comparisons. Multiple reference sets are used where needed so that control tire wear does not affect accuracy.
We use professional-grade testing equipment including GPS data loggers, accelerometers, and calibrated microphones. All tires are broken in and conditioned before testing begins. For full details on our equipment, preparation process, and calibration procedures, see our complete testing methodology.
Categories Tested
Dry Braking
For dry braking, I drive the test vehicle at an entry speed of 110 km/h and apply full braking effort to a standstill with ABS active on clean, dry asphalt. I typically use an 100–5 km/h measurement window. My standard programme is five runs per tire set where possible, although the sequence can extend to as many as fifteen runs if conditions and tire category justify it. I analyse the full set of runs and discard statistical outliers before averaging. Reference tires are run repeatedly throughout the session to correct for changing conditions.
Dry Handling
For dry handling, I drive at the limit of adhesion around a dedicated handling circuit with ESC disabled where possible so I can assess the tire's natural balance, transient response, and limit behaviour without electronic intervention masking the result. I usually complete between two and five timed laps per tire set, depending on the circuit, tire type, and consistency of conditions. I exclude laps affected by clear driver error or obvious environmental inconsistency. Control runs are carried out frequently throughout the session, and I often use multiple sets of control tires so that wear on the references does not become a meaningful variable. For more track-focused products, I also do endurance testing, which is a set number of laps at race pace to determine tire wear patterns and heat resistance over longer driving.
Subj. Dry Handling
Objective data is only part of the picture, so I also carry out a structured subjective handling assessment at the limit of adhesion on a dedicated dry handling circuit. I score steering precision, steering response, turn-in behaviour, mid-corner balance, corner-exit traction, breakaway characteristics, and overall confidence using a standardised 1–10 scale used consistently across my testing. The final assessment combines numeric scoring with written technical commentary. I complete familiarisation laps on the control tire before evaluating each candidate.
Wet Braking
For wet braking, I drive the test vehicle at an entry speed of 88 km/h and apply full braking effort to a standstill with ABS active on an asphalt surface with a controlled water film. I typically use an 80–5 km/h measurement window to isolate tire performance from variability in the initial brake application. My standard programme is eight runs per tire set where possible, although the sequence can extend to as many as fifteen runs if conditions and tire category justify it. I analyse the full set of runs and discard statistical outliers before averaging. To correct for changing conditions, I run reference tires repeatedly throughout the session — in wet testing, typically every three candidate test sets.
Wet Braking - Cool
This test follows the same procedure as the standard wet braking test — entry speed of 88 km/h, full ABS braking, VBOX measurement over the 80–5 km/h window — but is conducted at cooler ambient temperatures, typically below 7°C. The lower temperature allows assessment of how each tire's compound performs when cold, which is particularly relevant for all-season and winter tire evaluation. Reference tires are run at the same frequency as the standard wet braking programme.
Wet Handling
For wet handling, I drive at the limit of adhesion around a dedicated handling circuit. I generally use specialist wet circuits with kerb-watering systems designed to maintain a consistent surface condition. ESC is disabled where possible so I can assess the tire's natural balance, transient response, and limit behaviour without electronic intervention masking the result. I usually complete between two and five timed laps per tire set, depending on the circuit, tire type, and consistency of conditions. I exclude laps affected by clear driver error or obvious environmental inconsistency. Control runs are carried out frequently throughout the session, and I often use multiple sets of control tires so that wear on the references does not become a meaningful variable.
Subj. Wet Handling
Objective data is only part of the picture, so I also carry out a structured subjective handling assessment at the limit of adhesion on a dedicated wet handling circuit. I score steering precision, steering response, turn-in behaviour, mid-corner balance, aquaplaning resistance, breakaway characteristics, and overall confidence using a standardised 1–10 scale used consistently across my testing. The final assessment combines numeric scoring with written technical commentary. I complete familiarisation laps on the control tire before evaluating each candidate.
Straight Aqua
To measure straight-line aquaplaning resistance, I drive one side of the vehicle through a water trough of controlled depth, typically around 7 mm, while the opposite side remains on dry pavement. I enter at a fixed speed and then accelerate progressively. I define aquaplaning onset as the point at which the wheel travelling through the water exceeds a specified slip threshold relative to the dry-side reference wheel. I usually perform four runs per tire set and average the valid results.
Curved Aquaplaning
For curved aquaplaning, I use a circular track, typically around 100 metres in diameter, with a flooded arc of controlled water depth, usually about 7 mm. The vehicle is instrumented with GPS telemetry and a tri-axial accelerometer. I drive through the flooded section at progressively increasing speed, typically in 5 km/h increments, and record the minimum sustained lateral acceleration at each step. The test continues until lateral acceleration collapses, indicating complete aquaplaning. The result is expressed as remaining lateral acceleration in m/s² as speed rises.
Snow Braking
For snow braking, I drive the test vehicle at an entry speed of 50 km/h and apply full braking effort to a standstill with ABS active on a groomed, compacted snow surface, measuring 45-5 km/h. I generally use a wide VDA (vehicle dynamic area) and progressively move across the surface between runs so that no tire ever brakes on the same piece of snow twice. My standard programme is twelve runs per tire set, although the sequence can extend further if the data justify it. I analyse the full set of runs and discard statistical outliers before averaging. The surface is regularly groomed throughout the session. To correct for changing snow surface conditions, I run reference tires repeatedly — typically every two candidate test sets.
Snow Traction
For snow traction, I accelerate the vehicle from rest on a groomed snow surface with traction control active and measure speed and time using GPS telemetry. I typically use a 5–35 km/h measurement window to reduce the influence of launch transients and powertrain irregularities. I use a wide VDA (vehicle dynamic area) and progressively move across the surface between runs so that no tire ever accelerates on the same piece of snow twice. The surface is regularly groomed throughout the session. I complete multiple runs per tire set and average the valid results. Reference tires are run typically every two candidate test sets to correct for changing snow surface conditions.
Snow Handling
For snow handling, I drive at the limit of adhesion around a dedicated snow handling circuit with ESC disabled where possible. The circuit is groomed and prepared after every run while tires are being changed, so each set runs on a consistently prepared surface. I usually complete between two and five timed laps per tire set, excluding laps affected by clear driver error or obvious environmental inconsistency. Because snow surfaces degrade more rapidly than asphalt, control runs are carried out more frequently — typically every two candidate test sets.
Subj. Snow Handling
Objective data is only part of the picture, so I also carry out a structured subjective handling assessment at the limit of adhesion on a dedicated snow handling circuit. The circuit is groomed and prepared after every run while tires are being changed, so each set runs on a consistently prepared surface. I score steering precision, turn-in behaviour, mid-corner balance, corner-exit traction, breakaway characteristics, and overall confidence on snow using a standardised 1–10 scale used consistently across my testing. The final assessment combines numeric scoring with written technical commentary. I complete familiarisation laps on the control tire before evaluating each candidate.
Ice Braking
For ice braking, I drive the test vehicle at an entry speed of 35 km/h and apply full braking effort to a standstill with ABS active on a prepared ice surface. Surface temperature is continuously monitored as ice friction properties vary substantially with temperature. My standard programme is twelve runs per tire set but with ice testing, you often do many more. I analyse the full set of runs and discard statistical outliers before averaging. Reference tires are run typically every two candidate test sets to correct for changing surface conditions.
Ice Traction
For ice traction, I accelerate the vehicle from rest on a prepared ice surface with traction control active and measure speed and time using GPS telemetry. I typically use a 5–35 km/h measurement window to reduce the influence of launch transients. I use a wide VDA (vehicle dynamic area) and progressively move across the surface between runs so that no tire ever accelerates on the same piece of ice twice. Surface temperature is continuously monitored. I complete multiple runs per tire set and average the valid results, with reference tires run typically every two candidate test sets.
Subj. Comfort
To assess comfort, I drive on a wide range of road surfaces (often dedicated comfort tracks at test facilities) at speeds from 50 to 120 km/h, including smooth motorway, coarse surfaces, expansion joints, broken pavement, and sharp-edged obstacles. I evaluate primary ride quality, secondary ride quality, impact harshness, seat-transmitted vibration, and the tire's ability to absorb sharp inputs. Ratings are assigned on a 1–10 scale relative to the reference tire.
Noise
I measure external pass-by noise in accordance with UNECE Regulation 117 and ISO 13325 using the coast-by method on a compliant test surface. Calibrated microphones are positioned beside the test lane, and the vehicle coasts through the measurement zone under controlled conditions. I record the maximum A-weighted sound pressure level in dB(A), complete multiple runs over the relevant speed range, and normalise the result to the reference speed required by the procedure.
Rolling Resistance
Rolling resistance is measured under controlled laboratory conditions in accordance with ISO 28580 and UNECE Regulation 117 Annex 6. The tire is mounted on a test wheel and loaded against a large-diameter steel drum. After thermal stabilisation at the prescribed test speed, rolling resistance force is measured at the spindle and corrected according to the relevant procedure. The result is expressed as rolling resistance coefficient, typically in kg/tonne.
How each category is weighted in the overall score:
Dry30%
Dry Braking50%
Dry Handling40%
Subj. Dry Handling10%
Wet40%
Wet Braking25%
Wet Braking - Cool25%
Wet Handling30%
Subj. Wet Handling10%
Straight Aqua5%
Curved Aquaplaning5%
Snow10%
Snow Braking40%
Snow Traction20%
Snow Handling30%
Subj. Snow Handling10%
Ice5%
Ice Braking60%
Ice Traction40%
Comfort5%
Subj. Comfort50%
Noise50%
Value10%
Rolling Resistance100%
Snow
In snow handling, as usual, the Michelin CrossClimate 2 performed the best, feeling like a winter tire. Pirelli and Continental were very close, with Pirelli having an edge in fun factor, though it could improve its braking. The budget tire was surprisingly good in the snow, just a little slow to react but with good grip. Bridgestone and Vredestein were last among the premium tires, both lacking a little bite. The Vredestein had a particularly soft feel, making everything happen slowly.
All the all-season tires were significantly better than the summer tire in snow conditions. The summer tire performed so poorly that the car got stuck on a very slight hill during traction and braking tests.
Snow Braking
Spread: 27.71 M (158.6%)|Avg: 21.64 M
Snow braking in meters (40 - 5 km/h) [Average Temperature -6c] (Lower is better)
Snow Braking: Safety Impact: Best vs Worst Tire
Snow Traction
Spread: 24.81 s (480.8%)|Avg: 8.22 s
Snow acceleration time (5 - 35 km/h) [Average Temperature -5c] (Lower is better)
Reference Winter Ref
5.16 s
Michelin CrossClimate 2
5.31 s
Reference Winter Avg Ref
5.38 s
Pirelli Cinturato All Season SF3
5.42 s
Grenlander GreenWing AS
5.53 s
Continental AllSeasonContact 2
5.60 s
Bridgestone Turanza All Season 6
5.69 s
Vredestein Quatrac Pro Plus
5.95 s
Reference Summer Ref
29.97 s
Snow Handling
Spread: 65.02 s (83.1%)|Avg: 88.81 s
Snow handling time in seconds (Lower is better)
Reference Winter Ref
78.28 s
Michelin CrossClimate 2
79.65 s
Reference Winter Avg Ref
79.74 s
Pirelli Cinturato All Season SF3
81.84 s
Continental AllSeasonContact 2
82.72 s
Grenlander GreenWing AS
83.33 s
Bridgestone Turanza All Season 6
84.76 s
Vredestein Quatrac Pro Plus
85.69 s
Reference Summer Ref
143.30 s
Ice
This year I had the time to test ice traction. The Pirelli excelled in this area, closely followed by the Continental. Surprisingly, the budget tire (Grenlander) also performed well in ice traction. This further supports the theory that the budget tire might be using a winter compound molded into an all-season pattern.
Ice Traction
Spread: 13.05 s (290%)|Avg: 6.28 s
Ice acceleration time (5 - 25 km/h) (Lower is better)
Reference Winter Ref
4.50 s
Grenlander GreenWing AS
4.50 s
Pirelli Cinturato All Season SF3
4.57 s
Michelin CrossClimate 2
4.70 s
Reference Winter Avg Ref
4.82 s
Bridgestone Turanza All Season 6
5.15 s
Continental AllSeasonContact 2
5.29 s
Vredestein Quatrac Pro Plus
5.47 s
Reference Summer Ref
17.55 s
The budget all season tire also performed well in ice braking. Among the premium tires, Continental and Pirelli showed the best performance, closely followed by Michelin.
Ice Braking
Spread: 23.16 M (256.5%)|Avg: 12.66 M
Ice braking in meters (25 - 5 km/h) (Lower is better)
Ice Braking: Safety Impact: Best vs Worst Tire
Wet
The budget tire performed exceptionally poorly in wet conditions, being over 23 seconds slower than the group. This poor wet performance, combined with its good ice performance, suggests it might be using a single winter compound for various tire types..
The Michelin CrossClimate 2 placed 5th, about 5% off the best performers. The top 4 tires (Bridgestone, Pirelli, Vredestein, and Continental) were remarkably close in performance, within one-tenth of a second of each other. The Bridgestone stood out for its stability and predictability. Pirelli showed great turn-in and grip but was slightly slower to recover from slides. Vredestein was a bit vague on the front axle but still impressive. Continental was the fastest by a small margin, though not as sporty feeling as Bridgestone or Pirelli.
Wet Handling
Spread: 27.45 s (26.6%)|Avg: 110.70 s
Wet handling time in seconds [Average Temperature 21.5c] (Lower is better)
Reference Summer Ref
103.02 s
Reference Winter Ref
107.35 s
Continental AllSeasonContact 2
107.96 s
Vredestein Quatrac Pro Plus
108.17 s
Pirelli Cinturato All Season SF3
108.22 s
Bridgestone Turanza All Season 6
108.24 s
Reference Winter Avg Ref
110.41 s
Michelin CrossClimate 2
112.49 s
Grenlander GreenWing AS
130.47 s
Wet braking tests revealed significant differences among the tires. The Pirelli Cinturato All Season SF3 clearly outperformed the competition with the shortest stopping distance of 25.14M. The Bridgestone Turanza All Season 6 came in second at 26.6M, followed closely by the Continental AllSeasonContact 2 at 27.04M.
The Michelin CrossClimate 2, despite its overall strong performance in other areas, showed slightly longer stopping distances in wet conditions at 27.25M. The Vredestein Quatrac Pro Plus was the least effective among the premium tires with a distance of 27.47M.
The budget Grenlander GreenWing AS significantly underperformed in wet braking, with a stopping distance of 35.36M, much longer than the premium tires, raising serious safety concerns.
The difference in stopping distances between the best performer (Pirelli) and the worst (Grenlander) was substantial at over 10 meters, emphasizing the critical importance of tire choice for wet weather safety.
Wet Braking
Spread: 11.47 M (48%)|Avg: 28.30 M
Wet braking in meters (80 - 5 km/h) [Average Temperature 26.5c] (Lower is better)
Wet Braking: Safety Impact: Best vs Worst Tire
Wet Braking - Cool
Spread: 11.45 M (44.9%)|Avg: 27.86 M
Wet braking at cooler temperature in meters (80 - 5 km/h) [Average Temperature 8c] (Lower is better)
Wet Braking - Cool: Safety Impact: Best vs Worst Tire
The Pirelli was also the best in the deeper water of the aquaplaning tests.
Straight Aqua
Spread: 9.90 Km/H (12.5%)|Avg: 75.20 Km/H
Float Speed in Km/H (Higher is better)
Pirelli Cinturato All Season SF3
79.10 Km/H
Michelin CrossClimate 2
77.60 Km/H
Continental AllSeasonContact 2
77.10 Km/H
Bridgestone Turanza All Season 6
77.00 Km/H
Reference Summer Ref
76.50 Km/H
Vredestein Quatrac Pro Plus
75.70 Km/H
Reference Winter Ref
73.00 Km/H
Reference Winter Avg Ref
71.62 Km/H
Grenlander GreenWing AS
69.20 Km/H
Curved Aquaplaning
Spread: 0.87 m/sec2 (33.2%)|Avg: 2.26 m/sec2
Remaining lateral acceleration (Higher is better)
Bridgestone Turanza All Season 6
2.62 m/sec2
Pirelli Cinturato All Season SF3
2.55 m/sec2
Reference Summer Ref
2.54 m/sec2
Continental AllSeasonContact 2
2.46 m/sec2
Michelin CrossClimate 2
2.28 m/sec2
Vredestein Quatrac Pro Plus
2.12 m/sec2
Reference Winter Avg Ref
2.07 m/sec2
Grenlander GreenWing AS
1.92 m/sec2
Reference Winter Ref
1.75 m/sec2
Dry
The dry performance tests revealed some interesting results. The budget tire performed poorly, showing instability during lane change exercises. Michelin and Vredestein were adequate but not recommended for performance driving. Vredestein was a bit imprecise but had good grip, while Michelin performed well below the limit but showed extra understeer at the limit.
Continental felt more relaxed due to a wider steering dead spot, but showing good grip, especially over bumps. Pirelli impressed with strong braking and front-end grip. Surprisingly, Bridgestone came closest to matching summer tire performance, showing amazing grip despite a slight deadspot in steering.
The summer tire still had an edge in braking and mid-corner performance, but the gap has narrowed significantly, especially with the Bridgestone and Pirelli in this 19" size.
Dry Handling
Spread: 4.52 s (5.4%)|Avg: 86.68 s
Dry handling time in seconds (Lower is better)
Reference Summer Ref
84.30 s
Bridgestone Turanza All Season 6
84.96 s
Pirelli Cinturato All Season SF3
85.84 s
Continental AllSeasonContact 2
86.45 s
Reference Winter Ref
87.02 s
Vredestein Quatrac Pro Plus
87.09 s
Michelin CrossClimate 2
87.41 s
Reference Winter Avg Ref
88.24 s
Grenlander GreenWing AS
88.82 s
The Pirelli was also the best in dry braking, followed by the Michelin and Bridgestone.
Dry Braking
Spread: 7.76 M (22.6%)|Avg: 38.72 M
Dry braking in meters (100 - 5 km/h) [Average Temperature 25.5c] (Lower is better)
Dry Braking: Safety Impact: Best vs Worst Tire
Comfort
Noise levels were relatively close across all tested tires, with only a small spread in decibel readings. The Michelin CrossClimate 2 and Vredestein Quatrac Pro Plus were the quietest, while the Bridgestone Turanza All Season 6 was slightly louder than the group average.
While a comprehensive comfort analysis wasn't possible due to weather, subjective assessments suggest that the Pirelli and Continental offered the best overall comfort, both in terms of minor and big impacts. They are all 19" tires with low sidewalls, so the differences were smaller than usual.
Noise
Spread: 2.40 dB (3.4%)|Avg: 72.62 dB
External noise in dB (Lower is better)
Reference Winter Ref
71.40 dB
Michelin CrossClimate 2
72.00 dB
Vredestein Quatrac Pro Plus
72.10 dB
Grenlander GreenWing AS
72.40 dB
Reference Winter Avg Ref
72.72 dB
Pirelli Cinturato All Season SF3
72.90 dB
Continental AllSeasonContact 2
73.00 dB
Reference Summer Ref
73.30 dB
Bridgestone Turanza All Season 6
73.80 dB
Subj. Comfort
Spread: 1.50 Points (15%)|Avg: 9.33 Points
Subjective Comfort Score (Higher is better)
Continental AllSeasonContact 2
10.00 Points
Pirelli Cinturato All Season SF3
10.00 Points
Vredestein Quatrac Pro Plus
9.50 Points
Michelin CrossClimate 2
9.00 Points
Grenlander GreenWing AS
9.00 Points
Bridgestone Turanza All Season 6
8.50 Points
Value
Rolling resistance tests provided interesting insights into the energy efficiency of these tires. The Michelin CrossClimate 2 demonstrated the lowest rolling resistance, which translates to better fuel efficiency and potentially lower CO2 emissions. It was closely followed by the Pirelli Cinturato All Season SF3.
The Bridgestone showed moderate rolling resistance, while the Vredestein Quatrac Pro Plus had the highest rolling resistance among the tested tires. The budget Grenlander tire performed surprisingly well in this test, showing lower rolling resistance than some premium brands.
Rolling Resistance
Spread: 2.14 kg / t (27.6%)|Avg: 8.74 kg / t
Rolling resistance in kg t (Lower is better)
Michelin CrossClimate 2
7.76 kg / t
Pirelli Cinturato All Season SF3
7.99 kg / t
Continental AllSeasonContact 2
8.31 kg / t
Grenlander GreenWing AS
8.54 kg / t
Reference Winter Ref
8.65 kg / t
Reference Winter Avg Ref
8.78 kg / t
Bridgestone Turanza All Season 6
9.01 kg / t
Vredestein Quatrac Pro Plus
9.68 kg / t
Reference Summer Ref
9.90 kg / t
19,000 km
£1.45/L
8.0 L/100km
--
Annual Difference
--
Lifetime Savings
--
Extra Fuel/Energy
--
Extra CO2
Estimates based on typical driving conditions. Rolling resistance accounts for approximately 20% of IC vehicle fuel consumption and 25% of EV energy consumption. Actual savings vary based on driving style, vehicle weight, road conditions, and tire age. For comparative purposes only. Lifetime savings based on a 40,000km / 25,000 mile tread life.
Results
Below are the overall results from this all season test, be sure to keep an eye on Tire Reviews for the winter test, then the in depth comparison of the all season, winter and summer tires.
Joint highest dry performance rating, top-rated wet performance, second-highest snow performance, above-average ice traction, high comfort rating, second-lowest rolling resistance.
None.
It's a strong win for the Pirelli Cinturato All Season SF3. Pirelli have been rapidly evolving their aftermarket line of tires recently, and the SF series has been through multiple iterations to get to this point, and it's been worth it. The tire was joint best in the dry, the best in the wet, second best overall in the snow, good on ice, comfortable and had the second best rolling resistance. It's a hugely impressive tire.
Highest dry performance rating, wet performance within 1% of top-rated, handling characteristics most similar to summer tires.
Median snow performance, highest ride firmness, among the highest rolling resistance values.
The Bridgestone Turanza All Season 6 is the tire you'd fit of the second places if you live in a mild climate, it was the best in the dry, a whisker off the best in the wet and of all the tires, it felt the closest to a summer tire. It's drawbacks, well, it was very average in the snow, had a firmer ride than the other tires and a high rolling resistance.
Consistent performance across all metrics, predominantly ranking 2nd or 3rd in 18 distinct tests.
No standout performance in any specific category.
The Continental AllSeasonContact 2 is the tire that tried to do everything well, which means while it didn't jump out in any one area, it doesn't have any major drawbacks either, finishing either 2nd or 3rd overall in nearly every single test which is mighty impressive. I think all season tires should be balanced, and the Continental does that better than nearly any other tire.
Highest overall snow performance rating, lowest noise emission, lowest rolling resistance, dry braking performance in top percentile.
Wet grip performance below average for test group.
The Michelin CrossClimate 2 is the tire you'd fit if you're in climate that gets a lot of snow, as it was the best overall in the snow, had the lowest noise and the lowest rolling resistance. While its dry braking was also very good, its grip in the wet is still lacking compared to the best. I look forward to the next version improving this.
Below-average snow performance compared to other all-season tires, dry braking distance longer than top performers.
The Vredestein Quatrac Pro Plus excelled in the wet and was pretty good in the dry. Its snow performance wasn't the best, but it was still a lot better than the summer tire which is what we want from an all season tire, especially if you're in a mild climate. I'd like to see a bit more dry braking but otherwise a good tire from the dutch company. Remember, this is a mid range tire in a test dominated by the biggest manufacturers in the world.
High performance in snow conditions, top-rated for ice traction, lowest noise levels in the test group.
Lowest dry grip performance, wet grip 45% below top performer, lowest aquaplaning resistance, below-average refinement, highest rolling resistance in test group.
The Grenlander Greenwing AS was good on snow, the best on ice and very quiet, but that's where the positives end. It had awful grip in the dry, really awful grip in the wet - 45% worse than the best, awful aquaplaning resistance, poor refinement and a high rolling resistance. It's an all season tire that only works in the most extreme parts of winter, which I'm pretty sure indicates it's a cheap soft winter compound from a budget manufacturer that they just put an all season sidewall plate on to try and sell some tires. Don't do it.
Hello there! I have a Mercedes-Benz S-class Long 4Matic 2017, and I am looking for all season tires. Unfortunately the size of my tires is 245/45 R19, which drops the Pirelli out of the list (size is not offered). I am looking for an alternative, which in this case might be the Continental or the Bridgestone. I have hot summer around 20% of my drive, 75% mild seasonal with occasional raining and 15-25C and not more than 5% driving in snow. The Continental / Michelin and Bridgestone tires are widely available at our local stores, but I am not really sure which one to pick. The Michelin seems to be a bit more wintery-oriented, and on a contrast, the Bridgestones and Continentals are more well-balanced. Having in mind that for my car there is also a need of higher comfort and noise reduction, what are your suggestions? Thank you!
Hello! I am just off of hours and hours of tire research for the best all season option for a 2019 Buick Encore Preferred. I'm so happy to have stumbled upon your site. I drive 6,000 miles a year on average, almost never in the light snow, infrequently go above 70 MPH and am quite the careful driver (which drives my husband crazy). I'm looking for the best options for safety and comfort while driving in the rain and dry driving. I would greatly appreciate any advice. Thank you!
I have new audi s5 b10 and i am wondering if taking pirellis over set of summer and winter is a good idea. I wont be pushing car to the limits on public roads. If i get interested in track then i will have special set for track.
The Pirelli all season? The CrossClimate 3 Sport would be a better match on an S5 but the Pirelli will work, it's just not going to unlock the potential of an S5.
Yup, allseason sf3. It seemed very close to michelin 3 sport.
I am fine with both to be honest.
I am just wondering how much I will be missing out without a dedicated performance summer tire ( my car came with goodyear f1 supersport which isnt that great anynore with the dataset on the website).
sorry for these questions, its my first time haking a car with more horsepower.
I would like to do an ocassional launch control in dry conditions. I might also accelerate more agresively on straight line for overtaking. I am not used to going quickly in the corners. Maybe if i take some lessons to know the limits of the car or to learn how to combat oversteer/understeer.
A good find, this website! Comprehensive test and review of all season tires.
Considering investing in all-season tires for my car - a 2016 Skoda Yeti 2.0 diesel - is it worth it?
What are pros / cons of running these over a conventional 'UK standard' fitted (summer?) tire - e.g. do they last a long?
Broadly the driving I do comprises maybe 95% main roads (with the majority at lower urban speeds) and 5% driving on rougher roads, e.g. untarmac'd lanes, rural car parks (for hikes) and campsite fields!
We live in Cardiff, UK, so a relatively stable climate - warmer summer months (with regular wet spells) and cooler, generally wetter winters with some cold (generally frosty / icy) snaps....and a transitional mild (often wet!) period in between these two main climates.
Can I just ask, for the most common sized tires / cars (16"-18" - my car has 17" wheels) are these results still applicable?
Also, if I considered moving up to an 18" tire, what effect might that have?
There's plenty of all season tire tests on the site with summer tires as reference, including 17" tests so I suggest reading through the data from those and seeing if you're happy with the compromise an all season tire brings for the advantages you get when it's really cold / snowing.
Awesome test once again, just to get your expert opinion, we are looking for a set of all season (3PMSF, as its mandatory for Germany which we visit a lot) for our Model Y, size 255/45/19 which limits it a bit. Which would you recommend? hardly no snow driving and if its snow, it's just a small layer, few mm), just cold wet weather and warm dry/wet weather. (The Netherlands)
Hello! My Continental allseasoncontact 2 were mounted on my car on Saturday. However, I have just noticed that on both right tires the DOT can be seen, but on the left ones the DOT cannot be seen. My concern is whether if the tires were properly mounted. The rotation arrow is pointing in the right direction on all 4. Another difference is that on the ones were the DOT cannot be seen, the inscription “made in France” is visible, whilst for the other 2 it isn’t. Thank you for your responses!
They're directional tires, so you are seeing two different sides of the tires. The DOT is only printed on one side, so it's not a problem, they are mounted correctly.
I’m looking for some advice on what to buy next. I currently drive a 2019 Audi A6 Avant on Michelin CrossClimate 2s. They’ve been okay-ish, but after just two years they’ve already deformed, despite having plenty of tread left. The road noise has become quite noticeable-I'm assuming that’s due to the deformation.
I’m based in western Germany, where winters are mild with little to no snow (typically around 0-5°C), and summers reach 25-30°C.
I’m considering the Pirelli Cinturato All Season SF3, but I’m not fully convinced yet. My top priorities are low noise, safety, and comfort.
Also, a slightly dumb question: I read that tires can deform due to vehicle weight. Since my car weighs around 1800 kg, should I actually be looking into SUV tires instead?
Would love to hear your thoughts-thanks in advance!
Does the car spend a lot of time not moving? As long as your load rating is as the vehicle specified, they should be fine. I've not heard many stories about the CC2 deforming, yours might be the first.
The car is actually a daily driver-it’s only parked for maybe one day a week. Looking back at my mileage, the tires have done around 40,000 km, which I guess is a reasonable lifespan. :)
Now, back to choosing new tires-I saw your review of the CrossClimate 3. Do you think they’re worth waiting for? And do you have any idea when they might be available in Germany?
I’ll need new tires in the next few weeks as we’re planning a family vacation with quite a bit of long-distance driving. So I’m wondering if I should just go ahead with the Pirelli Cinturato All Season SF3, even if they might not be as quiet as I’d want.
Hi John. I would really be interested in a test of the exact same tires you used in this test but after being stored for 2 to 3 years. It would be very important to know how each one will perform after being tested and then stored for 2-3 years. I think it’s critical for choosing the right tire. PS. It could be even better if the tires were being used during the 2-3 years but then it would be more subjective by being used probably differently.
Hey John, do you think it would be possible in the future to include a deep snow benchmark? It would be helpful for someone like me who gets a lot of snow. I know, there's a lot of factors that go along with that, but would be interesting nonetheless.
Probably not for an all season test. I tried to do one recently but the deep snow pad was too deep for the Golf test car.
Not many test facilities leave a deep snow section too as honestly the data isn't very good as it can't be prepared, you're stuck with what nature gives you.
The amount of information is fabulous but also overwhelming. I typically have gone with Michelin as quietness and comfort have been my priority but I’m open to options that are less pricey. Is there an easy way to sort tires using filters like noise, comfort, speed, price point? I live in western Canada and drive an Audi A4 Quattro Cabriolet on which I switch summers out for winters.
No, but I would be confident in an educated guess of Bridgestone biggest and Pirelli medium. Conti I don't recall (I just tested the BS and Pirelli for another test)
@TireReviews:disqus Hello! Great tests and thank you for your work! I would love to have your opinion on a matter. I'm looking to get tires for the winter season. I e been using the Blizzark lm005s and happy with them but given your testing here, I'm contemplating the Pirellies. Given that winters in Romania are about a week of snow a year and temps between -5 to 10. It seems the Pirelli would provide the overall better performance in dry and wet conditions and maybe even come close on snow. The tires are even cheaper then the Blizzark locally. Would you go for uhp winter tire or the all season? :) car is a cupra 280 if that makes a difference.
I am looking to buy a new car where I live in south of France. We absolutely need 3PMSA tires here as they are compulsory for four months every year (or chains or socks but yeah great …). But it is impossible to find a car manufacturer that offers 3PMSA tires as an OEM option. I have tried MB, BMW, Renault, Jaguar, Toyota and all refuse to sell a new car with anything except a randomly chosen summer tire. Why would I buy a new car from them and then have to throw away the tires to fit Michelin CC2s (which everybody uses here). I can specify a new car with anything except option/colour/gadget I want - but have to take the lottery on a random sumer tire. You can have any colour you want as long as it is black Henry Ford once said…
It is time to lobby manufacturers to offer 3PMSA tires as an OEM option - they are just so good nowadays.
Great article! Choosing the right all-season tires can make a huge difference in both performance and safety. I appreciate how you’ve broken down the features of each option for 2024/2025. One thing I’ve noticed when selecting tires is that tread design and compound quality play a big role in handling across various conditions. It's good to see brands like Dunlop Tires focusing on balancing durability, traction in wet conditions, and fuel efficiency.
Great job as always, Jonathan! I am torn between the Pirelli and the Bridgestone, I live in a very mild climate, maybe snow 1-5 days a winter, rest is 5-10 + degrees C and rainy. I drive GY Vector 4S gen 3 now and happy with them, but would want more bite and positive feedback in summer (around 20+ C) from them, what to go for? I use 225/50R17 on a Jaguar S type
Hi. Jonathan, you doo awesome work! But why in second test miss Goodyear Vector 4Seasons Gen3? I'm very interesting what show this tire at test. Actually i have Gen2 & are good. Have a nice day, my english is poor.
I was interested in his test as I have this size tires on my car (Cupra Leon). However, what I am interested in is how all-season tires perform against summer tires, for most of the year and in summer.
Here in the UK, we only have a few days of snow at most & no more than a few inches (cm) outside of hilly areas, and the temperature is barely below 5°C for more than a few nights at a time. I only ever need anything other than summer tires to get to the end of my road; after that the roads are gritted. If I was to get all season tires, they'd have to perform very close to summer tires for the other 350+ days of the year.
How about testing all season tires against their equivalent UHP summer tires, in summer (or the British version of summer)?
I'm more interested in what is the performance cost of a good all-season tire, compared to a range of summer tires, for the majority of the year.
Perhaps the next summer tire test should include a 'reference' all-season tire, like the Pirelli or the Bridgestone, or head to heads - Pirelli v Pirelli, Michelin v Michelin, etc.
May I ask which reference summer tire you used? In your 2023 Best Summer Tire Test, for instance, there were more than three seconds of difference in the wet between six UHP summer tires. It would have been helpful to know how close the all-season tires come to that specific summer tire.
It would be interesting if you were to have a "tire wearing machine" that the tire producers use themselves so you could compare the wear rate and characteristics after x y and z wear. Sort of a next step.
Is the CrossClimate2 really the quietest tire out of all these? Whenever I've asked about the quietest, most comfortable tire everyone recommends I stay away from them, including Tire Rack. Current recommendations I've gotten from reviews and tire installers are the P7 Cinturato AS Plus 2/3 and the new Sincera 250 A/S (720AA version).
I know your shouldn't mix summer and all season tires but is it ok to mix different brands of all season tires so long as you have the same brand across each axle?
In a perfect world you would have 4 perfectly matching tires but in reality mixing front and rear is very common. Just try and put the better gripping one on the rear for safety
Wet performance is most important thing for me... and for that reason using All Season tires would seem like logical step (instead of Touring or UHP). However, when I looked at all best All Season tires (CC2 > T AS6 > CAS SF3) they all have B rating on EU Label... however decent Touring tires like Brigestone Turanza 6, Michelin Primacy 4/4+, Goodyear BlueResponse Performance 2 and many others consistently have A rating.
So considering that I DO NOT CARE about snow and ice, because in UK we never get more than 2 days of it (at least in Southern part) - would it be better just to get myself a decent Touring tire which is A rated for wet grip? Or somehow B for All Season is better than A for Summer tire when it comes to wet grip.
Now sure - I know EU Labelling is not perfect, does not represent many conditions and tire manufacturers literally scores themselves there. But let's take example of Brigestone Turanza 6 All Season and normal Turanza 6... the same manufacturer marked the same exact size tire, of the same generation differently... so is it the case that Turanza 6 All season has worse vet grip than normal Turanza 6?
Also I guess... if we ever had snow and that would be relevant, then perhaps B for vet grip is worthy compromise, but considering All Season tires are at least 50% more expensive, also are worse on fuel and noise... could it be the case that in relatively mild Southern UK climate - Touring tires are simply better choice? Like - is there maybe a temperature point where suddenly All Season tires becomes better in "cold" wet than Summer tires, or vet grip is absolute and the tire "accurately" marked as A will always be better than B... (again with caveat that I don't compare premium tire with budget, or tires of different generations, but literally the tires from same manufacturer).
The EU label isn't super reliable, and is always tested at summer temperatures. In the cold winter months a B all season would vastly out perform an A summer, something to keep in mind
I'm in the same situation, from what I read all season performs worse than summer tire in UK climate, yet quite a lot of reviews are advocating of all season tires in the UK. Snow is rare, winters are mild. From the above tests it looks like summer outperforms all of those unless ice/snow even in colder temps. What did you end up getting?
Agreed it’s frustrating when a great tire is not available your ideal size! I wonder if further sizes might be released in the future? Does that ever happen?
I think this is due to the production capacity at Pirelli factories. They just don't have a production line that can produce tires with such a low profile and such a width. There is no expectation that they will add this size. It's not likely to happen. It's a shame, because I would consider buying such a tire and would be happy to get rid of my summer and winter tires. It is annoying to have to change tires all the time(2 times a year).
This tire has very good performance in both summer and winter. No other tire is so versatile. Such a tire makes it pointless to have two sets of summer and winter wheels.
It’s interesting, it does seem that latest reviews suggest the latest all seasons are suitable for year round use, especially in milder climates, but almost universally I am told not to do this on my Golf R as I need the UHP tires in summer. It’s shame we can’t try out different tires as consumers as I’m sure that some sports car drivers really would be disappointed with anything less than a UHP/UUHP but I really wonder if I need such a tire as I’m not really pushing limits in corners…
Hmm, I sense a real hesitance to state that all seasons are anywhere close to being a suitable year round alternative on the Golf R. I guess it really comes down to the definition of “pushing it”…
Pirelli probably produce the biggest range of sizes of all manufacturers, this will be a volume / economies of scale issue. PErhaps it will come in the future, they can certainly make it
@TireReviews:disqus could you please confirm something that strikes me as odd... I've been pondering on switching to allseasons from summer-winter mix for a while. My main criteria is maximum performance on icy roads on cold sub-zero mornings, since it is the most risky situation for my driving habits.
When I go and compare the raw data (distance, time) for e.g. Michelin CC2 (I would pick GY 4 seasons G3, but CC2 is closest there is) and Goodyear UltraGrip Performance 3 or Continental TS870 P in your BEST Performance Winter Tires for 2024 / 2025, Michelin is better on ice. I always thought that allseasons are generally better on wet and dry surfaces, might struggle on snow but usually fail on ice and sub-zero. And here the results say completely different. Have allseasons really started to be that good? Thanks
There's a merging of the product lines that is certainly confusing. One caveat here is that the winter tires are UHP winter tires, which generally have a little less winter grip than their "normal" counterparts
Would you say the Bridgestones were uncomfortable/firm when compared to a UHP tire, say the Potenza S001, or is it more relative to the other tires only? I currently have the S001s and the turanza all season 6s seem to tick all boxes but I wouldn’t mind slightly more comfort than the S001…
Could I ask you @TireReviews:disqus , what would you think would be more comfortable - the turanza AS6 in 235/40/18 or the Pirelli SF3 in 225/40/18? It’s an extra 0.2inches of sidewall. The SF3 doesn’t come in 235/40/18, otherwise I would have gone for that!
Thank you for the reply, really appreciate it! Would you say the same about noise I.e way better than the s001 but noisy compared to the other tires in the all season test?
Hi! Were you using "XL" labeled tires? In a lot of sizes (especially all season tires) there are only XL variants available e.g. the Pirelli C. SF3 according to pirelli.com in 235/35R19. Were the non XL and XL version so similar lately that it is not worth to manufacture both? I'm a bit reluctant to fit XL tires on my Alfa because it might be extra strain on the expensive suspension component on the eastern european roads.
For example wet braking in meters (80 - 5 km/h) for Pirelli Cinturato SF3 : - 205/55 R16 does it for 35.5 meters [Average Temperature 17.5c] - 235/35 R19 does it for 25.14 meters [Average Temperature 26.5c] & 25.51 meters [Average Temperature 8c]
There is a 10 meter difference between the two results and that's huge :) Are the larger size tires that much better in the wet or there are other reasons?
I think Golf GTI has better brakes than Golf 1.4. And maybe different surface and also that width od tire makes that difference. Jonathan told that many times, that results can't be cross referenced between tests, because of different conditions in every testing.
Thank you Okrujko, I agree with all the aspects that you've mentioned and the fact that these do contribute to the final result. Futher more I just compared the other tires and all of them have e gap: - Bridgestone Tur. All Season 6: 6.6 meters difference - Conti ASC2: 7.8 meters difference - Michelin CC2: 10 meters difference
Still, 10 meters gap sounds a lot to me :) and I am wonderin if the there isn't somnething else that's impactinbg the results like: load index, tire tempreture and mostly the factory they come from. I know tha the 205/55 R16 Pirelli Cinturato SF3 are made in Romania. Not sure about the 235/35 R19 though. Do you have any idea?
If you've not spotted the reply above from TR to Okrujko, he suggests its the differing surface grip of the wet braking lane. So at a different test site you have different setup, tarmac surface, levels of water on lane, temps, spray pattern perhaps, etc. Not to mention car and tire size differences interacting too.
Make sense. But what is interesting, that the difference between various tires is not the same. So it can be another parameter of good tire, consistency on various surfaces.
Remember decades ago when top gear used to review normal cars, I.e. cavaliers and sieras? Rather than what it became - (what the average driver can't afford). What about the 'normal' brands that most independent small garages carry? Nokian, hankook, toyo, Kumho, Goodyear, lassa,Dunlop etc. Don't get me wrong, your doing a great job!, and it's a big ask to include everything, but its not just about what's new and 'king of the hill', it's about availability and budget. Maybe a mid range test that includes what each manufacturer has for sale today - regardless if it's last year's model or not - would be better for consumers?
Hankook Kinergy 4S2 was reviewed last year and it performed 2nd. Most likely Micheline was there because it was a winner last year so you can compare it... The problem of testing midrange tires is in so many different of them on the market.
Great tests, I love your site! I'm missing a test that I can't really find anywhere and I don't understand why. On a dry road, but below freezing, say -5 or -10 Celsius. How do all season tires behave in this situation? Will there be an advantage to winter tires or would all season tires be better? In winter, I often drive in such conditions and there is no such test anywhere.
It's hard to test as it's not a very common situation!
Based on my understanding a summer tire would still beat a winter tire even in such cold conditions as long as it's dry, so I would expect the all season to still be better.
Love the video but having a hard time tracking down any of these (other than the Michelin CrossClimate 2) at America's Tire/Discount Tire, Les Schwab, Costco Tire Center, and TireRack.com. I called them and asked them to reach out to their rep at Continental for example and they hadn't even heard of the AllSeasonContact 2 yet. A bit frustrating look at all these that I would love to throw on my vehicle but they're just not really out there yet in my experience. Where are people getting these tires?
Hi, thank you for including a summer tire in this test. Honestly I've been looking for this kind of data these days as I was planning on buying an UHP tire but even the sc7 with its class leading wet performance in your previous tests still delivers an abysmal 50 meters compared to the summer tire you've tested here. In fact I can't find any summer tire that performed that good in previous testings. Assuming comparable, AS tires or mild performance tires such as ps5 or pc7 deliver vastly superior wet performance (almost double) that UUHP tires seem unsafe except for the most arid of places. My question is this; all other factors being equal, does UUHP tires (specifically sc7) really take 20-25 meters longer to brake in wet or am I misinterpreting something? I can't sell it to myself but I really want to.
It's not possible to compare braking distances between different tests due to conditions having a big impact in overall performance. The summer tire in this test is the PZ4 which is not as good as the SC7 in the wet.
CFDK I believe the score in the article above and the score in the video is not identical. Some tires are different as well. Do the article or the video have the newest data? Vrederstein is not in the video and Yokohama is not in the article?
The best all seasons don’t seem that far off from the summer reference. Would you ever consider fitting them year round to a performance car such as a golf r if one were not going to track the car and also would not be pushing it to the limits in corners? More of a daily driver with some acceleration on the straights.
Is that because personally you'd want maximum performance year-round? I.e, that all-seasons are a compromise vs summer/winter specific tires. If you only had the budget for one set of year-round tires, it looks like all-seasons offer better braking than summers in cold, damp conditions? Which in the south of the UK is half the year, at the time when low-light levels and poor visibility mean incidents are more likely.
How is tire degradation for the Pirelli? I was thinking between that and the Michelin. The winter performance is very important for me, and the Pirelli is not far from Michelin as it seems but I have read that Pirellis usually have a problem with wear. So in the end I have chosen the Michelin.
I am still thinking if I choose the right tire, but last weekend we have had a pretty big rain while I was traveling through mountain roads and highways and the tire handled it perfectly. I saw at least two cars run off the road.
Superb test. The comparison with a summer UHP reference is really useful and particularly at both the warmer/cooler temps.
These all seasons are looking less and less compromised for year-round usage, especially for such as here in northern England. Any more tests you could do to explore that further would be ace.
Don´t need AS/Winter-tires atm but maybe some of my colleagues.
The Pirelli-win is no surprise for me, it won this year in Autobild Sportcars and was compared in Auto Zeitung with the SF2 and the SF3 was much better overall.
What I miss: Tires from Goodyear, Kleber and Hankook. Maybe not the newest tires but common and often used. And nothing about the RIM-protection which is very important for me, especially in this size
last year I was driving Hankook Kinergy 4s2 on my Mazda Mazda6 GH as my first set of all season tires. Sadly, They only lasted me one year ( 34 000Km) and they were gone... after 30 000km, the wet grip started to be really awful. According to Your review, I did buy new Bridgestone turanza AS 6, and I hope they will do the job a lil bit longer ?.
Great article, just cements results of last all season feat. Appreciate your work!
I was drawn towards 235/40/18 tires over 225/40/18, thinking the extra sidewall would help comfort and extra width would help with rim protection when curbside parking. The problem is that the SF3 is not available in this size.
Do you think 235/40/18 in the conti or Bridgestone would provide meaningful improvement in comfort and rim protection compared to 225/40/18 SF3, or would the superior characteristics of the sf3 outweigh the size difference?
Maybe one day SF3 will be available in 235/40R18... Who knows - otherwise I think we are talking such close results between the tires that as Jonathan says near the end - Bridgestone / Conti / Michelin are all good also not sure how much sense it makes to worry not having the Pirelli. Plus, don't know if you would be interested in mileage performance - I think this is the only big point not tested nor discussed here that could change the balance quite much (if that is something the end user would watch).


What was the the reference summer tire please?
Doh! - Pirelli P Zero PZ4
Hello there! I have a Mercedes-Benz S-class Long 4Matic 2017, and I am looking for all season tires.
Unfortunately the size of my tires is 245/45 R19, which drops the Pirelli out of the list (size is not offered).
I am looking for an alternative, which in this case might be the Continental or the Bridgestone. I have hot summer around 20% of my drive, 75% mild seasonal with occasional raining and 15-25C and not more than 5% driving in snow.
The Continental / Michelin and Bridgestone tires are widely available at our local stores, but I am not really sure which one to pick. The Michelin seems to be a bit more wintery-oriented, and on a contrast, the Bridgestones and Continentals are more well-balanced.
Having in mind that for my car there is also a need of higher comfort and noise reduction, what are your suggestions?
Thank you!
Hello! I am just off of hours and hours of tire research for the best all season option for a 2019 Buick Encore Preferred. I'm so happy to have stumbled upon your site. I drive 6,000 miles a year on average, almost never in the light snow, infrequently go above 70 MPH and am quite the careful driver (which drives my husband crazy). I'm looking for the best options for safety and comfort while driving in the rain and dry driving. I would greatly appreciate any advice. Thank you!
I have new audi s5 b10 and i am wondering if taking pirellis over set of summer and winter is a good idea. I wont be pushing car to the limits on public roads. If i get interested in track then i will have special set for track.
The Pirelli all season? The CrossClimate 3 Sport would be a better match on an S5 but the Pirelli will work, it's just not going to unlock the potential of an S5.
Yup, allseason sf3. It seemed very close to michelin 3 sport.
I am fine with both to be honest.
I am just wondering how much I will be missing out without a dedicated performance summer tire ( my car came with goodyear f1 supersport which isnt that great anynore with the dataset on the website).
sorry for these questions, its my first time haking a car with more horsepower.
I would like to do an ocassional launch control in dry conditions.
I might also accelerate more agresively on straight line for overtaking. I am not used to going quickly in the corners. Maybe if i take some lessons to know the limits of the car or to learn how to combat oversteer/understeer.
It's certainly noticeable. I'm not sure whether it will be upsetting for you or not though.
A good find, this website! Comprehensive test and review of all season tires.
Considering investing in all-season tires for my car - a 2016 Skoda Yeti 2.0 diesel - is it worth it?
What are pros / cons of running these over a conventional 'UK standard' fitted (summer?) tire - e.g. do they last a long?
Broadly the driving I do comprises maybe 95% main roads (with the majority at lower urban speeds) and 5% driving on rougher roads, e.g. untarmac'd lanes, rural car parks (for hikes) and campsite fields!
We live in Cardiff, UK, so a relatively stable climate - warmer summer months (with regular wet spells) and cooler, generally wetter winters with some cold (generally frosty / icy) snaps....and a transitional mild (often wet!) period in between these two main climates.
Can I just ask, for the most common sized tires / cars (16"-18" - my car has 17" wheels) are these results still applicable?
Also, if I considered moving up to an 18" tire, what effect might that have?
There's plenty of all season tire tests on the site with summer tires as reference, including 17" tests so I suggest reading through the data from those and seeing if you're happy with the compromise an all season tire brings for the advantages you get when it's really cold / snowing.
Awesome test once again, just to get your expert opinion, we are looking for a set of all season (3PMSF, as its mandatory for Germany which we visit a lot) for our Model Y, size 255/45/19 which limits it a bit. Which would you recommend? hardly no snow driving and if its snow, it's just a small layer, few mm), just cold wet weather and warm dry/wet weather. (The Netherlands)
yo, as a not-car-guy, i just wanted to say thank you
:)
Hello! My Continental allseasoncontact 2 were mounted on my car on Saturday. However, I have just noticed that on both right tires the DOT can be seen, but on the left ones the DOT cannot be seen.
My concern is whether if the tires were properly mounted. The rotation arrow is pointing in the right direction on all 4.
Another difference is that on the ones were the DOT cannot be seen, the inscription “made in France” is visible, whilst for the other 2 it isn’t.
Thank you for your responses!
They're directional tires, so you are seeing two different sides of the tires. The DOT is only printed on one side, so it's not a problem, they are mounted correctly.
Yes, logic said that too, but I am a newbie and I thought that each tire should have the DOT visible.
Thank you a lot, sir!
Great article-really appreciate the insight!
I’m looking for some advice on what to buy next. I currently drive a 2019 Audi A6 Avant on Michelin CrossClimate 2s. They’ve been okay-ish, but after just two years they’ve already deformed, despite having plenty of tread left. The road noise has become quite noticeable-I'm assuming that’s due to the deformation.
I’m based in western Germany, where winters are mild with little to no snow (typically around 0-5°C), and summers reach 25-30°C.
I’m considering the Pirelli Cinturato All Season SF3, but I’m not fully convinced yet. My top priorities are low noise, safety, and comfort.
Also, a slightly dumb question: I read that tires can deform due to vehicle weight. Since my car weighs around 1800 kg, should I actually be looking into SUV tires instead?
Would love to hear your thoughts-thanks in advance!
Does the car spend a lot of time not moving? As long as your load rating is as the vehicle specified, they should be fine. I've not heard many stories about the CC2 deforming, yours might be the first.
Thanks so much for your reply!
The car is actually a daily driver-it’s only parked for maybe one day a week. Looking back at my mileage, the tires have done around 40,000 km, which I guess is a reasonable lifespan. :)
Now, back to choosing new tires-I saw your review of the CrossClimate 3. Do you think they’re worth waiting for? And do you have any idea when they might be available in Germany?
I’ll need new tires in the next few weeks as we’re planning a family vacation with quite a bit of long-distance driving. So I’m wondering if I should just go ahead with the Pirelli Cinturato All Season SF3, even if they might not be as quiet as I’d want.
Really appreciate your input-thanks again!
Hi John. I would really be interested in a test of the exact same tires you used in this test but after being stored for 2 to 3 years. It would be very important to know how each one will perform after being tested and then stored for 2-3 years. I think it’s critical for choosing the right tire.
PS. It could be even better if the tires were being used during the 2-3 years but then it would be more subjective by being used probably differently.
Judging by other test data , 2-3 years storage they would still be like new. I've seen tests of 8 year old tires with minimal performance drop.
Hey John, do you think it would be possible in the future to include a deep snow benchmark? It would be helpful for someone like me who gets a lot of snow. I know, there's a lot of factors that go along with that, but would be interesting nonetheless.
Probably not for an all season test. I tried to do one recently but the deep snow pad was too deep for the Golf test car.
Not many test facilities leave a deep snow section too as honestly the data isn't very good as it can't be prepared, you're stuck with what nature gives you.
It's always being worked on though.
The amount of information is fabulous but also overwhelming. I typically have gone with Michelin as quietness and comfort have been my priority but I’m open to options that are less pricey. Is there an easy way to sort tires using filters like noise, comfort, speed, price point?
I live in western Canada and drive an Audi A4 Quattro Cabriolet on which I switch summers out for winters.
Not currently, sorry, you just have to look at test results
Hi John, do you recall how big the rim protection was for the pirelli, Bridgestone and continental?
No, but I would be confident in an educated guess of Bridgestone biggest and Pirelli medium. Conti I don't recall (I just tested the BS and Pirelli for another test)
Appreciate the quick response! I think that is what I was expecting,
appreciate the input!
@TireReviews:disqus Hello! Great tests and thank you for your work! I would love to have your opinion on a matter. I'm looking to get tires for the winter season. I e been using the Blizzark lm005s and happy with them but given your testing here, I'm contemplating the Pirellies. Given that winters in Romania are about a week of snow a year and temps between -5 to 10. It seems the Pirelli would provide the overall better performance in dry and wet conditions and maybe even come close on snow. The tires are even cheaper then the Blizzark locally. Would you go for uhp winter tire or the all season? :) car is a cupra 280 if that makes a difference.
Or is there an alternative uhp all season for the EU?
Sadly no such thing as UHP AS in EU currently, the Bridgestone is probably the closest but still far off.
I am looking to buy a new car where I live in south of France. We absolutely need 3PMSA tires here as they are compulsory for four months every year (or chains or socks but yeah great …). But it is impossible to find a car manufacturer that offers 3PMSA tires as an OEM option. I have tried MB, BMW, Renault, Jaguar, Toyota and all refuse to sell a new car with anything except a randomly chosen summer tire. Why would I buy a new car from them and then have to throw away the tires to fit Michelin CC2s (which everybody uses here). I can specify a new car with anything except option/colour/gadget I want - but have to take the lottery on a random sumer tire. You can have any colour you want as long as it is black Henry Ford once said…
It is time to lobby manufacturers to offer 3PMSA tires as an OEM option - they are just so good nowadays.
Volvo offers Michelin CC2 as OEM option.
Great article! Choosing the right all-season tires can make a huge difference in both performance and safety. I appreciate how you’ve broken down the features of each option for 2024/2025. One thing I’ve noticed when selecting tires is that tread design and compound quality play a big role in handling across various conditions. It's good to see brands like Dunlop Tires focusing on balancing durability, traction in wet conditions, and fuel efficiency.
cannot recommend the Pirelli P Zero... front 2 sidewalls split after 20,000 miles & 4 years on my Bentley GTC...
Missing the obvious Conti DWS06+ aren't we?
As fun as it would be to have in a test like this, No, that's a us only market, non three peak marked, uhp all season tire. A different category
Great job as always, Jonathan! I am torn between the Pirelli and the Bridgestone, I live in a very mild climate, maybe snow 1-5 days a winter, rest is 5-10 + degrees C and rainy. I drive GY Vector 4S gen 3 now and happy with them, but would want more bite and positive feedback in summer (around 20+ C) from them, what to go for? I use 225/50R17 on a Jaguar S type
I'm not sure, both good choices. The Bridgestone will last longer but the Pirelli will perform better when it snows.
Can you point us to the US equivalent of the Pirelli Cinturato All Season SF3?
https://www.tyrereviews.com...
Hi. Jonathan, you doo awesome work! But why in second test miss Goodyear Vector 4Seasons Gen3? I'm very interesting what show this tire at test. Actually i have Gen2 & are good. Have a nice day, my english is poor.
There are many all season tests on the site with the Goodyear, I've tested it before so missed it from this one.
Hi! What do U think about Nokian Seasonproof 1 and Pirelli Powergy all season sf? Thanks!
I've never seen them compared, sorry.
Sorry guys, is the 'Pirelli Cinturato All Seasons SF3' tested in 2024 the same tire tested in 2024/2025? As the results are not coherent! Thanks
Yep, same tire, different size. What differences concern you?
I was interested in his test as I have this size tires on my car (Cupra Leon). However, what I am interested in is how all-season tires perform against summer tires, for most of the year and in summer.
Here in the UK, we only have a few days of snow at most & no more than a few inches (cm) outside of hilly areas, and the temperature is barely below 5°C for more than a few nights at a time. I only ever need anything other than summer tires to get to the end of my road; after that the roads are gritted. If I was to get all season tires, they'd have to perform very close to summer tires for the other 350+ days of the year.
How about testing all season tires against their equivalent UHP summer tires, in summer (or the British version of summer)?
You mean like the reference summer tire in this very test??
I'm more interested in what is the performance cost of a good all-season tire, compared to a range of summer tires, for the majority of the year.
Perhaps the next summer tire test should include a 'reference' all-season tire, like the Pirelli or the Bridgestone, or head to heads - Pirelli v Pirelli, Michelin v Michelin, etc.
May I ask which reference summer tire you used? In your 2023 Best Summer Tire Test, for instance, there were more than three seconds of difference in the wet between six UHP summer tires. It would have been helpful to know how close the all-season tires come to that specific summer tire.
Pirelli P Zero PZ4
Thank you
It would be interesting if you were to have a "tire wearing machine" that the tire producers use themselves so you could compare the wear rate and characteristics after x y and z wear. Sort of a next step.
There's been a lot of investment in drum wear machines but none correlate perfectly with road yet.
Do you have any opinions on the new Hankook iON Flex Climate? I'm looking for new all-season tires for a Tesla Model 3.
Is the CrossClimate2 really the quietest tire out of all these? Whenever I've asked about the quietest, most comfortable tire everyone recommends I stay away from them, including Tire Rack. Current recommendations I've gotten from reviews and tire installers are the P7 Cinturato AS Plus 2/3 and the new Sincera 250 A/S (720AA version).
This is a test of the euro spec cc2, which has a few differences, notably much less tread depth so less noise at new state.
I know your shouldn't mix summer and all season tires but is it ok to mix different brands of all season tires so long as you have the same brand across each axle?
In a perfect world you would have 4 perfectly matching tires but in reality mixing front and rear is very common. Just try and put the better gripping one on the rear for safety
Wet performance is most important thing for me... and for that reason using All Season tires would seem like logical step (instead of Touring or UHP). However, when I looked at all best All Season tires (CC2 > T AS6 > CAS SF3) they all have B rating on EU Label... however decent Touring tires like Brigestone Turanza 6, Michelin Primacy 4/4+, Goodyear BlueResponse Performance 2 and many others consistently have A rating.
So considering that I DO NOT CARE about snow and ice, because in UK we never get more than 2 days of it (at least in Southern part) - would it be better just to get myself a decent Touring tire which is A rated for wet grip? Or somehow B for All Season is better than A for Summer tire when it comes to wet grip.
Now sure - I know EU Labelling is not perfect, does not represent many conditions and tire manufacturers literally scores themselves there. But let's take example of Brigestone Turanza 6 All Season and normal Turanza 6... the same manufacturer marked the same exact size tire, of the same generation differently... so is it the case that Turanza 6 All season has worse vet grip than normal Turanza 6?
Also I guess... if we ever had snow and that would be relevant, then perhaps B for vet grip is worthy compromise, but considering All Season tires are at least 50% more expensive, also are worse on fuel and noise... could it be the case that in relatively mild Southern UK climate - Touring tires are simply better choice? Like - is there maybe a temperature point where suddenly All Season tires becomes better in "cold" wet than Summer tires, or vet grip is absolute and the tire "accurately" marked as A will always be better than B... (again with caveat that I don't compare premium tire with budget, or tires of different generations, but literally the tires from same manufacturer).
The EU label isn't super reliable, and is always tested at summer temperatures. In the cold winter months a B all season would vastly out perform an A summer, something to keep in mind
I'm in the same situation, from what I read all season performs worse than summer tire in UK climate, yet quite a lot of reviews are advocating of all season tires in the UK. Snow is rare, winters are mild. From the above tests it looks like summer outperforms all of those unless ice/snow even in colder temps. What did you end up getting?
Hi Jonathan,
Why is the tire with 10 points in Subj. Comfort category scoring 5th, and not 1st, there? Is this a mistake?
Thanks and cheers
Thanks for pointing that out, I've now fixed it
Too bad there are no Pirelli Cinturato All Season SF3 in size 215/40/17.
Agreed it’s frustrating when a great tire is not available your ideal size! I wonder if further sizes might be released in the future? Does that ever happen?
I think this is due to the production capacity at Pirelli factories. They just don't have a production line that can produce tires with such a low profile and such a width. There is no expectation that they will add this size. It's not likely to happen. It's a shame, because I would consider buying such a tire and would be happy to get rid of my summer and winter tires. It is annoying to have to change tires all the time(2 times a year).
This tire has very good performance in both summer and winter. No other tire is so versatile. Such a tire makes it pointless to have two sets of summer and winter wheels.
It’s interesting, it does seem that latest reviews suggest the latest all seasons are suitable for year round use, especially in milder climates, but almost universally I am told not to do this on my Golf R as I need the UHP tires in summer. It’s shame we can’t try out different tires as consumers as I’m sure that some sports car drivers really would be disappointed with anything less than a UHP/UUHP but I really wonder if I need such a tire as I’m not really pushing limits in corners…
If you're not pushing at all, all seasons are getting closer, but they still like the bite of a summer
Hmm, I sense a real hesitance to state that all seasons are anywhere close to being a suitable year round alternative on the Golf R. I guess it really comes down to the definition of “pushing it”…
Pirelli probably produce the biggest range of sizes of all manufacturers, this will be a volume / economies of scale issue. PErhaps it will come in the future, they can certainly make it
@TireReviews:disqus could you please confirm something that strikes me as odd...
I've been pondering on switching to allseasons from summer-winter mix for a while. My main criteria is maximum performance on icy roads on cold sub-zero mornings, since it is the most risky situation for my driving habits.
When I go and compare the raw data (distance, time) for e.g. Michelin CC2 (I would pick GY 4 seasons G3, but CC2 is closest there is) and Goodyear UltraGrip Performance 3 or Continental TS870 P in your BEST Performance Winter Tires for 2024 / 2025, Michelin is better on ice. I always thought that allseasons are generally better on wet and dry surfaces, might struggle on snow but usually fail on ice and sub-zero. And here the results say completely different. Have allseasons really started to be that good? Thanks
There's a merging of the product lines that is certainly confusing. One caveat here is that the winter tires are UHP winter tires, which generally have a little less winter grip than their "normal" counterparts
Would you say the Bridgestones were uncomfortable/firm when compared to a UHP tire, say the Potenza S001, or is it more relative to the other tires only? I currently have the S001s and the turanza all season 6s seem to tick all boxes but I wouldn’t mind slightly more comfort than the S001…
Could I ask you @TireReviews:disqus , what would you think would be more comfortable - the turanza AS6 in 235/40/18 or the Pirelli SF3 in 225/40/18? It’s an extra 0.2inches of sidewall. The SF3 doesn’t come in 235/40/18, otherwise I would have gone for that!
I'd be guessing, it would probably be very close!
More relative to other tires, way better than s001
Thank you for the reply, really appreciate it! Would you say the same about noise I.e way better than the s001 but noisy compared to the other tires in the all season test?
I haven't seen Nokian tires lately in any test. Maybe you could check the Seasonproof 1 one day?
Plenty of Nokian coming soon :)
Hi!
Were you using "XL" labeled tires? In a lot of sizes (especially all season tires) there are only XL variants available e.g. the Pirelli C. SF3 according to pirelli.com in 235/35R19.
Were the non XL and XL version so similar lately that it is not worth to manufacture both?
I'm a bit reluctant to fit XL tires on my Alfa because it might be extra strain on the expensive suspension component on the eastern european roads.
Yes. These days XL is mostly meaningless in these sizes
Hi,
This is the first time I comment any of your articles, but don't get me wrong - I read them all and I really enjoy it :)
I have a question regarding the differeces between the values of your tests:
https://www.tyrereviews.com/Article/Best-All-Season-Tyres-2024.htm from March and this one.
For example wet braking in meters (80 - 5 km/h) for Pirelli Cinturato SF3 :
- 205/55 R16 does it for 35.5 meters [Average Temperature 17.5c]
- 235/35 R19 does it for 25.14 meters [Average Temperature 26.5c] & 25.51 meters [Average Temperature 8c]
There is a 10 meter difference between the two results and that's huge :) Are the larger size tires that much better in the wet or there are other reasons?
Will be looking forward to your answer! :)
Best regards,
Phil
I think Golf GTI has better brakes than Golf 1.4. And maybe different surface and also that width od tire makes that difference. Jonathan told that many times, that results can't be cross referenced between tests, because of different conditions in every testing.
Thank you Okrujko,
I agree with all the aspects that you've mentioned and the fact that these do contribute to the final result. Futher more I just compared the other tires and all of them have e gap:
- Bridgestone Tur. All Season 6: 6.6 meters difference
- Conti ASC2: 7.8 meters difference
- Michelin CC2: 10 meters difference
Still, 10 meters gap sounds a lot to me :) and I am wonderin if the there isn't somnething else that's impactinbg the results like: load index, tire tempreture and mostly the factory they come from. I know tha the 205/55 R16 Pirelli Cinturato SF3 are made in Romania. Not sure about the 235/35 R19 though. Do you have any idea?
If you've not spotted the reply above from TR to Okrujko, he suggests its the differing surface grip of the wet braking lane. So at a different test site you have different setup, tarmac surface, levels of water on lane, temps, spray pattern perhaps, etc. Not to mention car and tire size differences interacting too.
Braking ability is similar between the two vehicles, surface grip of the wet braking lane will be the big difference.
Make sense. But what is interesting, that the difference between various tires is not the same. So it can be another parameter of good tire, consistency on various surfaces.
Brakes has nothing to do in wet breaking. Brakes matter when you race and brake hard a lot... Otherwise it is the tire that makes the difference.
This is a great test if you have a big budget.
Remember decades ago when top gear used to review normal cars, I.e. cavaliers and sieras? Rather than what it became - (what the average driver can't afford).
What about the 'normal' brands that most independent small garages carry? Nokian, hankook, toyo, Kumho, Goodyear, lassa,Dunlop etc.
Don't get me wrong, your doing a great job!, and it's a big ask to include everything, but its not just about what's new and 'king of the hill', it's about availability and budget.
Maybe a mid range test that includes what each manufacturer has for sale today - regardless if it's last year's model or not - would be better for consumers?
Hankook Kinergy 4S2 was reviewed last year and it performed 2nd. Most likely Micheline was there because it was a winner last year so you can compare it...
The problem of testing midrange tires is in so many different of them on the market.
Very interesting test!
I would love to see the relatively new Dunlop All Season 2 to be tested as well, before I decide.
There's test data on the site for this now
thank you!
Great tests, I love your site! I'm missing a test that I can't really find anywhere and I don't understand why. On a dry road, but below freezing, say -5 or -10 Celsius. How do all season tires behave in this situation? Will there be an advantage to winter tires or would all season tires be better? In winter, I often drive in such conditions and there is no such test anywhere.
It's hard to test as it's not a very common situation!
Based on my understanding a summer tire would still beat a winter tire even in such cold conditions as long as it's dry, so I would expect the all season to still be better.
Will other wheel sizes rank similarly, or might they change things drastically?
Love the video but having a hard time tracking down any of these (other than the Michelin CrossClimate 2) at America's Tire/Discount Tire, Les Schwab, Costco Tire Center, and TireRack.com. I called them and asked them to reach out to their rep at Continental for example and they hadn't even heard of the AllSeasonContact 2 yet. A bit frustrating look at all these that I would love to throw on my vehicle but they're just not really out there yet in my experience. Where are people getting these tires?
Unfortunately most of these are EU specific patterns, sorry.
Dang. Based on your response, do you have any recommendations for the US that's like your content?
Hi, thank you for including a summer tire in this test. Honestly I've been looking for this kind of data these days as I was planning on buying an UHP tire but even the sc7 with its class leading wet performance in your previous tests still delivers an abysmal 50 meters compared to the summer tire you've tested here. In fact I can't find any summer tire that performed that good in previous testings. Assuming comparable, AS tires or mild performance tires such as ps5 or pc7 deliver vastly superior wet performance (almost double) that UUHP tires seem unsafe except for the most arid of places.
My question is this; all other factors being equal, does UUHP tires (specifically sc7) really take 20-25 meters longer to brake in wet or am I misinterpreting something? I can't sell it to myself but I really want to.
It's not possible to compare braking distances between different tests due to conditions having a big impact in overall performance. The summer tire in this test is the PZ4 which is not as good as the SC7 in the wet.
You have misinterpreted the data.
UUHP wet braking testing conducted at 100 - 0 kph. All-season / winter testing done at 80-5 kph.
The SC7 would have thrashed all others in wet braking and handling at these test temperatures.
CFDK
I believe the score in the article above and the score in the video is not identical. Some tires are different as well.
Do the article or the video have the newest data?
Vrederstein is not in the video and Yokohama is not in the article?
Yokohama isn't in the article or vidoe?
The best all seasons don’t seem that far off from the summer reference. Would you ever consider fitting them year round to a performance car such as a golf r if one were not going to track the car and also would not be pushing it to the limits in corners? More of a daily driver with some acceleration on the straights.
I personally would not.
Nov-Apr 4 seasons, May-Oct summer, is that a good idea?
Depending on location it certainly could be
Is that because personally you'd want maximum performance year-round? I.e, that all-seasons are a compromise vs summer/winter specific tires. If you only had the budget for one set of year-round tires, it looks like all-seasons offer better braking than summers in cold, damp conditions? Which in the south of the UK is half the year, at the time when low-light levels and poor visibility mean incidents are more likely.
But they are worse in the dry, and the wet warm conditions which is the other half of a year. Personally I've stayed on summer tires in the uk.
What do you think about all seasons for the UK all year round on a small family car Focus/Golf/Civic size?
How is tire degradation for the Pirelli? I was thinking between that and the Michelin. The winter performance is very important for me, and the Pirelli is not far from Michelin as it seems but I have read that Pirellis usually have a problem with wear. So in the end I have chosen the Michelin.
I am still thinking if I choose the right tire, but last weekend we have had a pretty big rain while I was traveling through mountain roads and highways and the tire handled it perfectly. I saw at least two cars run off the road.
The Pirelli is not the best but also the Michelin is also not great compared to the best.
Superb test. The comparison with a summer UHP reference is really useful and particularly at both the warmer/cooler temps.
These all seasons are looking less and less compromised for year-round usage, especially for such as here in northern England. Any more tests you could do to explore that further would be ace.
Big Thanks for this review :)
Don´t need AS/Winter-tires atm but maybe some of my colleagues.
The Pirelli-win is no surprise for me, it won this year in Autobild Sportcars and was compared in Auto Zeitung with the SF2 and the SF3 was much better overall.
What I miss: Tires from Goodyear, Kleber and Hankook. Maybe not the newest tires but common and often used. And nothing about the RIM-protection which is very important for me, especially in this size
last year I was driving Hankook Kinergy 4s2 on my Mazda Mazda6 GH as my first set of all season tires.
Sadly, They only lasted me one year ( 34 000Km) and they were gone... after 30 000km, the wet grip started to be really awful.
According to Your review, I did buy new Bridgestone turanza AS 6, and I hope they will do the job a lil bit longer ?.
Fingers crossed, leave a review!
Great article, just cements results of last all season feat. Appreciate your work!
I was drawn towards 235/40/18 tires over 225/40/18, thinking the extra sidewall would help comfort and extra width would help with rim protection when curbside parking. The problem is that the SF3 is not available in this size.
Do you think 235/40/18 in the conti or Bridgestone would provide meaningful improvement in comfort and rim protection compared to 225/40/18 SF3, or would the superior characteristics of the sf3 outweigh the size difference?
Maybe one day SF3 will be available in 235/40R18... Who knows - otherwise I think we are talking such close results between the tires that as Jonathan says near the end - Bridgestone / Conti / Michelin are all good also not sure how much sense it makes to worry not having the Pirelli.
Plus, don't know if you would be interested in mileage performance - I think this is the only big point not tested nor discussed here that could change the balance quite much (if that is something the end user would watch).
I've never tested it, I doubt it would be meaningful though
Is there an Pirelli SF3 in 235/55R19 dimension?