



While studded tires aren't suitable for the normal UK winter, Tire Reviews does have a lot of international readers, which is why we're covering this excellent studded winter tire test from the Swedish publications Vi Bilägare.
Why this one? Well, they've used a Volvo V30 to test seven studded tires in the very common 205/55 R16 tire size, and they've also included a friction studless nordic winter tire.
It's worth noting that the nordic winter tire included in the test, the Nokian Hakkapeliitta R3, is STILL too extreme for the UK winters. Instead we use a winter tire type called "European winter tire" which is covered in the Nokian line up by the WRD4 and WRA4.
These European winter tires are again a step below the nordic winter tires in snow and ice, but offer a better dry and wet performance, meaning they're more suitable to the type of winters we see in central Europe.
Dry / Wet
In the dry, Continental IceContact 2 was the only tire able to beat the Nordic friction tire, but in the wet the friction tire surpsingly performed badly, taking over 13 feet extra to stop when compared to the worst studded tire!
Dry Braking
Dry braking in feet
Lower is better ↓| Position / Tire | Result | Gap to best |
|---|---|---|
| 169 ft | Best | |
| 171 ft | +2 ft | |
| 171 ft | +2 ft | |
| 172 ft | +3 ft | |
| 172 ft | +3 ft | |
| 173 ft | +4 ft | |
| 176 ft | +7 ft | |
| 177 ft | +8 ft |
The difference between best and worst was 4.3% (8 ft ≈ 0.5 Car Lengths).
Wet Braking
Wet braking in feet
Lower is better ↓| Position / Tire | Result | Gap to best |
|---|---|---|
| 181 ft | Best | |
| 183 ft | +2 ft | |
| 183 ft | +2 ft | |
| 185 ft | +4 ft | |
| 190 ft | +9 ft | |
| 191 ft | +10 ft | |
| 195 ft | +14 ft | |
| 210 ft | +29 ft |
The difference between best and worst was 15.9% (29 ft ≈ 1.9 Car Lengths).
Snow
During the snow testing, the friction tire won both the traction and braking tests, but struggled more with the lateral stability requirements of the snow handling lap.
Snow Traction
Snow acceleration time
Lower is better ↓| Position / Tire | Result | Gap to best |
|---|---|---|
| 5.77 s | Best | |
| 5.79 s | +0.02 s | |
| 6.03 s | +0.26 s | |
| 6.05 s | +0.28 s | |
| 6.05 s | +0.28 s | |
| 6.05 s | +0.28 s | |
| 6.09 s | +0.32 s | |
| 6.4 s | +0.63 s |
The difference between best and worst was 10.9% (0.63 s).
Snow Braking
Snow braking in feet
Lower is better ↓| Position / Tire | Result | Gap to best |
|---|---|---|
| 60 ft | Best | |
| 60 ft | 0 ft | |
| 60 ft | 0 ft | |
| 62 ft | +2 ft | |
| 62 ft | +2 ft | |
| 62 ft | +2 ft | |
| 63 ft | +3 ft | |
| 63 ft | +3 ft |
The difference between best and worst was 4.1% (3 ft).
Snow Handling
Snow handling time in seconds
Lower is better ↓| Position / Tire | Result | Gap to best |
|---|---|---|
| 90.5 s | Best | |
| 92 s | +1.50 s | |
| 92.1 s | +1.60 s | |
| 93 s | +2.50 s | |
| 93.2 s | +2.70 s | |
| 94.5 s | +4.00 s | |
| 94.8 s | +4.30 s | |
| 97.5 s | +7.00 s |
The difference between best and worst was 7.7% (7 s).

Ice
Unsurprisingly, the studded tires had a big advantage during the ice testing.
Ice Traction
Ice acceleration time
Lower is better ↓| Position / Tire | Result | Gap to best |
|---|---|---|
| 3.97 s | Best | |
| 3.99 s | +0.02 s | |
| 4.12 s | +0.15 s | |
| 4.3 s | +0.33 s | |
| 4.71 s | +0.74 s | |
| 5.1 s | +1.13 s | |
| 5.74 s | +1.77 s | |
| 6.98 s | +3.01 s |
The difference between best and worst was 75.8% (3.01 s).
Ice Braking
Ice braking in feet
Lower is better ↓| Position / Tire | Result | Gap to best |
|---|---|---|
| 35 ft | Best | |
| 35 ft | 0 ft | |
| 38 ft | +3 ft | |
| 38 ft | +3 ft | |
| 40 ft | +5 ft | |
| 40 ft | +5 ft | |
| 50 ft | +15 ft | |
| 58 ft | +23 ft |
The difference between best and worst was 67% (23 ft ≈ 1.6 Car Lengths).
Ice Handling
Ice handling time in seconds
Lower is better ↓| Position / Tire | Result | Gap to best |
|---|---|---|
| 73.5 s | Best | |
| 74.6 s | +1.10 s | |
| 76.9 s | +3.40 s | |
| 80.9 s | +7.40 s | |
| 81.3 s | +7.80 s | |
| 81.5 s | +8.00 s | |
| 83.3 s | +9.80 s | |
| 86.4 s | +12.90 s |
The difference between best and worst was 17.6% (12.9 s).
Environment
The friction tire proved to be the quietest tire on test, and had the lowest rolling resistance.
Rolling Resistance
Rolling resistance in kg t
Lower is better ↓| Position / Tire | Result | Gap to best | Extra fuel / year |
|---|---|---|---|
| 4.12 kg/t | Best | $0 | |
| 4.19 kg/t | +0.07 kg/t | $5 | |
| 4.19 kg/t | +0.07 kg/t | $5 | |
| 4.3 kg/t | +0.18 kg/t | $13 | |
| 4.3 kg/t | +0.18 kg/t | $13 | |
| 4.36 kg/t | +0.24 kg/t | $17 | |
| 4.39 kg/t | +0.27 kg/t | $19 | |
| 4.59 kg/t | +0.47 kg/t | $34 |
The difference between best and worst was 11.4% (0.47 kg / t). Over 12,000 miles a year at $3.60/gal, the Continental IceContact 2 uses about 9 gal ($34) more fuel than the Nokian Hakkapeliitta R3.
Adjust the assumptions
Calculated estimates, not additional measurements. Use the controls to explore the assumptions.
Results
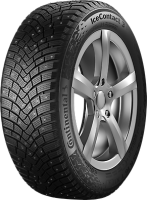
Continental IceContact 2
205/55 R16
Nokian Hakkapeliitta 9
205/55 R16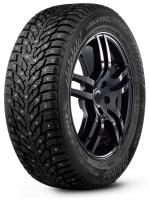
Goodyear UltraGrip Ice Arctic
205/55 R16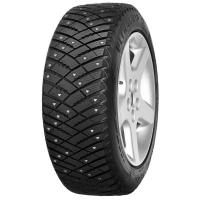
Gislaved Nord Frost 200
205/55 R16
Bridgestone Noranza 001
205/55 R16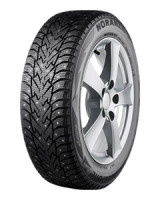
Yokohama iceGUARD iG65
205/55 R16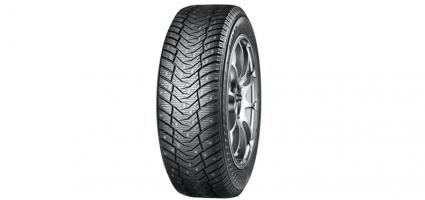
Nexen Winguard winSpike WH62
205/55 R16
Nokian Hakkapeliitta R3
205/55 R16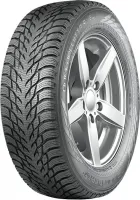
In Sweden, we usually shorten "us carowners" to ViB. Vi just means "we"...
PS: any tiretesting in scandinavia, I volunteer to join, agendas permitting.... Love tires ;)
Nexen should be last?
Score weighting can often effect overall results
Still odd, as the R3 bests the Nexen on all accounts except one, wet braking. Which does tend to hold high weighting, but still... R3 isn't even in the top three of best studdless nordic winter tires this year, so as a studded tire the Nexen is pretty awful...
Dry braking distance over 50 meters, that's scary! Too bad they didn't include any "european" winter tire for comparison, that would be interesting. But... they also tested a studless nordic tires, and for the reference they included, as they call it, a "continental winter tire" - not to be confused with the Continental ;)
http://www.vibilagare.se/te...