



Test setup & methodology
The test setting, the conditions recorded and how the results contribute to the score.
Recorded test conditions
Recorded test conditions
- Dry Braking
- 49.7 → 3.1 mph
- Wet Braking
- 49.7 → 3.1 mph
- Snow Braking
- 21.7 → 3.1 mph
- Snow Traction
- 3.1 → 21.7 mph
- Ice Braking
- 9.3 → 3.1 mph
- Ice Traction
- 3.1 → 9.3 mph
- Fuel Consumption
- 55.9 mph
As this is a studded winter tire test, the testers placed much more emphasis on snow and ice performance, so if you're in a region that sees a lot of compacted snow and ice on the road during normal winters, this is a very useful test.
Scroll down to see the full results.
Dry
The GT Radial IcePro 3 had a significant advantage during dry braking, with the next best Continental IceContact 3 nearly 7 feet behind.
Dry Braking
Dry braking in feet (50 - 3 mph)
Lower is better ↓| Position / Tire | Result | Gap to best | Residual speed |
|---|---|---|---|
| 95 ft | Best | 0 mph | |
| 101 ft | +6 ft | 20 mph | |
| 102 ft | +7 ft | 21 mph | |
| 102 ft | +7 ft | 21 mph | |
| 104 ft | +9 ft | 23 mph | |
| 105 ft | +10 ft | 25 mph | |
| 106 ft | +11 ft | 26 mph | |
| 109 ft | +14 ft | 29 mph |
The difference between best and worst was 15.3% (14 ft ≈ 1 Car Lengths). From 80 mph, the Nokian Nordman 7 would still be travelling at 29 mph when the GT Radial IcePro 3 had stopped.
Residual speed is calculated from the measured braking distances, assuming constant deceleration; it is not a separate measurement.
The magazine didn't give dry handling lap times, instead just awarding the tires subjective handling scores.
Subj. Dry Handling
Subjective Dry Handling Score
Higher is better ↑| Position / Tire | Result | Gap to best |
|---|---|---|
| 5 Points | Best | |
| 4 Points | -1.00 Points | |
| 3 Points | -2.00 Points | |
| 3 Points | -2.00 Points | |
| 3 Points | -2.00 Points | |
| 3 Points | -2.00 Points | |
| 2 Points | -3.00 Points | |
| 2 Points | -3.00 Points |
The difference between best and worst was 60% (3 Points).
Wet
In the wet the GT Radial held onto its advantage, with the Pirelli Ice Zero 2 a meter behind in second place.
Wet Braking
Wet braking in feet (50 - 3 mph)
Lower is better ↓| Position / Tire | Result | Gap to best | Residual speed |
|---|---|---|---|
| 111 ft | Best | 0 mph | |
| 114 ft | +3 ft | 13 mph | |
| 115 ft | +4 ft | 15 mph | |
| 119 ft | +8 ft | 20 mph | |
| 121 ft | +10 ft | 23 mph | |
| 121 ft | +10 ft | 23 mph | |
| 122 ft | +11 ft | 24 mph | |
| 128 ft | +17 ft | 29 mph |
The difference between best and worst was 14.9% (17 ft ≈ 1.1 Car Lengths). From 80 mph, the Nokian Nordman 7 would still be travelling at 29 mph when the GT Radial IcePro 3 had stopped.
Residual speed is calculated from the measured braking distances, assuming constant deceleration; it is not a separate measurement.
The GT Radial continued its advantage during a wet handling lap.
Wet Handling
Wet handling time in seconds
Lower is better ↓| Position / Tire | Result | Gap to best |
|---|---|---|
| 43.11 s | Best | |
| 43.77 s | +0.66 s | |
| 44.1 s | +0.99 s | |
| 44.12 s | +1.01 s | |
| 44.75 s | +1.64 s | |
| 45.17 s | +2.06 s | |
| 45.75 s | +2.64 s | |
| 45.75 s | +2.64 s |
The difference between best and worst was 6.1% (2.64 s).
Pirelli and GT again scored well during straight aquaplaning testing.
Straight Aqua
Float Speed in mph
Higher is better ↑| Position / Tire | Result | Gap to best |
|---|---|---|
| 40.1 mph | Best | |
| 39.8 mph | -0.3 mph | |
| 39.6 mph | -0.5 mph | |
| 39.1 mph | -1.0 mph | |
| 38.8 mph | -1.3 mph | |
| 38.6 mph | -1.5 mph | |
| 38.3 mph | -1.8 mph | |
| 36.9 mph | -3.2 mph |
The difference between best and worst was 8% (3.2 mph).
Snow
GT Radial couldn't continue its wins in the braking test, this time finishing last during snow braking. It's not unusual for a tire that performs well in the dry and wet to lack grip during snow and ice testing, however the Continental IceContact 3 proved to have a rounded ability.
Snow Braking
Snow braking in feet (22 - 3 mph)
Lower is better ↓| Position / Tire | Result | Gap to best | Residual speed |
|---|---|---|---|
| 34 ft | Best | 0 mph | |
| 34 ft | Best | 0 mph | |
| 34 ft | 0 ft | 2 mph | |
| 35 ft | +1 ft | 7 mph | |
| 35 ft | +1 ft | 8 mph | |
| 35 ft | +1 ft | 11 mph | |
| 35 ft | +1 ft | 11 mph | |
| 35 ft | +1 ft | 12 mph |
All the tires in the Snow Braking test finished less than 3% apart. From 80 mph, the GT Radial IcePro 3 would still be travelling at 12 mph when the Michelin X Ice North 4 had stopped.
Residual speed is calculated from the measured braking distances, assuming constant deceleration; it is not a separate measurement.
Snow traction showed a similar story.
Snow Traction
Snow acceleration time (3 - 22 mph)
Lower is better ↓| Position / Tire | Result | Gap to best |
|---|---|---|
| 3.62 s | Best | |
| 3.67 s | +0.05 s | |
| 3.67 s | +0.05 s | |
| 3.72 s | +0.10 s | |
| 3.75 s | +0.13 s | |
| 3.79 s | +0.17 s | |
| 3.83 s | +0.21 s | |
| 3.92 s | +0.30 s |
The difference between best and worst was 8.3% (0.3 s).
The winter specialists Nokian took their first win with the Hakkapeliita 9 during the important snow handling test.
Snow Handling
Snow handling time in seconds
Lower is better ↓| Position / Tire | Result | Gap to best |
|---|---|---|
| 74.62 s | Best | |
| 75.04 s | +0.42 s | |
| 75.19 s | +0.57 s | |
| 75.19 s | +0.57 s | |
| 75.69 s | +1.07 s | |
| 75.74 s | +1.12 s | |
| 76.85 s | +2.23 s | |
| 78.81 s | +4.19 s |
The difference between best and worst was 5.6% (4.19 s).

Ice
Ice braking had the Nokian and Michelin leading with a significant advantage.
Ice Braking
Ice braking in feet (9 - 3 mph)
Lower is better ↓| Position / Tire | Result | Gap to best | Residual speed |
|---|---|---|---|
| 11 ft | Best | 0 mph | |
| 11 ft | 0 ft | 9 mph | |
| 13 ft | +2 ft | 32 mph | |
| 14 ft | +3 ft | 34 mph | |
| 14 ft | +3 ft | 36 mph | |
| 15 ft | +4 ft | 41 mph | |
| 17 ft | +6 ft | 47 mph | |
| 17 ft | +6 ft | 48 mph |
The difference between best and worst was 54.8% (6 ft ≈ 0.4 Car Lengths). From 80 mph, the GT Radial IcePro 3 would still be travelling at 48 mph when the Nokian Hakkapeliitta 9 had stopped.
Residual speed is calculated from the measured braking distances, assuming constant deceleration; it is not a separate measurement.
Michelin and Nokian continued to lead during the ice traction testing.
Ice Traction
Ice acceleration time (3 - 9 mph)
Lower is better ↓| Position / Tire | Result | Gap to best |
|---|---|---|
| 1.89 s | Best | |
| 1.94 s | +0.05 s | |
| 2.08 s | +0.19 s | |
| 2.18 s | +0.29 s | |
| 2.22 s | +0.33 s | |
| 2.42 s | +0.53 s | |
| 2.8 s | +0.91 s | |
| 3.29 s | +1.40 s |
The difference between best and worst was 74.1% (1.4 s).
Rounding off their excellent snow performance, Michelin and Nokian also led in ice handling.
Ice Handling
Ice handling time in seconds
Lower is better ↓| Position / Tire | Result | Gap to best |
|---|---|---|
| 51.23 s | Best | |
| 51.4 s | +0.17 s | |
| 52.24 s | +1.01 s | |
| 53.52 s | +2.29 s | |
| 55.11 s | +3.88 s | |
| 56.42 s | +5.19 s | |
| 59.02 s | +7.79 s | |
| 61.42 s | +10.19 s |
The difference between best and worst was 19.9% (10.19 s).
Environment
Michelin proved to have the lowest rolling resistance on test.
Fuel Consumption
Fuel consumption in Liters per 100 km (56 - 56 mph)
Lower is better ↓| Position / Tire | Result | Gap to best | Extra fuel / year |
|---|---|---|---|
| 5.66 l/100km | Best | $0 | |
| 5.67 l/100km | +0.01 l/100km | $2 | |
| 5.69 l/100km | +0.03 l/100km | $6 | |
| 5.71 l/100km | +0.05 l/100km | $9 | |
| 5.74 l/100km | +0.08 l/100km | $15 | |
| 5.76 l/100km | +0.10 l/100km | $18 | |
| 5.76 l/100km | +0.10 l/100km | $18 | |
| 5.78 l/100km | +0.12 l/100km | $22 |
All the tires in the Fuel Consumption test finished less than 3% apart. Over 12,000 miles a year at $3.60/gal, the GT Radial IcePro 3 uses about 6 gal ($22) more fuel than the Michelin X Ice North 4.
Adjust the assumptions
Calculated estimates, not additional measurements. Use the controls to explore the assumptions.
Michelin also had the lowest subjective noise, being the only tire awarded 5/5.
Subj. Noise
Subjective in car noise levels
Higher is better ↑| Position / Tire | Result | Gap to best |
|---|---|---|
| 5 Points | Best | |
| 4 Points | -1.00 Points | |
| 3 Points | -2.00 Points | |
| 3 Points | -2.00 Points | |
| 2 Points | -3.00 Points | |
| 2 Points | -3.00 Points | |
| 2 Points | -3.00 Points | |
| 2 Points | -3.00 Points |
The difference between best and worst was 60% (3 Points).
Results
Michelin X Ice North 4
205/60 R16 96T XL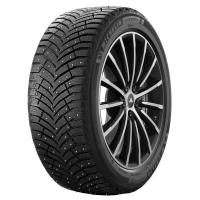
Category scores (% of best)
All discipline results (13)
Discipline positions compare the ranked tires in this test, not the whole market. These are individual measurements, not weighted overall scores.
| Test | Position in discipline | Result | Gap to best |
|---|---|---|---|
| Dry BrakingLower is better | 7th / 8 | 106 ft | +11 ft |
| Subj. Dry HandlingHigher is better | 1st / 8 | 5 Points | Best in this discipline |
| Wet BrakingLower is better | 3rd / 8 | 115 ft | +4 ft |
| Wet HandlingLower is better | 7th / 8 | 45.75 s | +2.64 s |
| Straight AquaHigher is better | 8th / 8 | 36.9 mph | -3.2 mph |
| Snow BrakingLower is better | 1st / 8 | 34 ft | Best in this discipline |
| Snow TractionLower is better | 2nd / 8 | 3.67 s | +0.05 s |
| Snow HandlingLower is better | 5th / 8 | 75.69 s | +1.07 s |
| Ice BrakingLower is better | 2nd / 8 | 11 ft | 0 ft |
| Ice TractionLower is better | 1st / 8 | 1.89 s | Best in this discipline |
| Ice HandlingLower is better | 1st / 8 | 51.23 s | Best in this discipline |
| Subj. NoiseHigher is better | 1st / 8 | 5 Points | Best in this discipline |
| Fuel ConsumptionLower is better | 1st / 8 | 5.66 l/100km | Best in this discipline |
- Origin
- Russia
Continental IceContact 3
205/60 R16 96T XL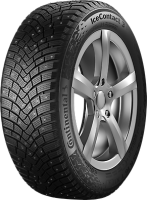
Category scores (% of best)
All discipline results (13)
Discipline positions compare the ranked tires in this test, not the whole market. These are individual measurements, not weighted overall scores.
| Test | Position in discipline | Result | Gap to best |
|---|---|---|---|
| Dry BrakingLower is better | 2nd / 8 | 101 ft | +6 ft |
| Subj. Dry HandlingHigher is better | 3rd / 8 | 3 Points | -2.00 Points |
| Wet BrakingLower is better | 5th / 8 | 121 ft | +10 ft |
| Wet HandlingLower is better | 2nd / 8 | 43.77 s | +0.66 s |
| Straight AquaHigher is better | 3rd / 8 | 39.6 mph | -0.5 mph |
| Snow BrakingLower is better | 1st / 8 | 34 ft | Best in this discipline |
| Snow TractionLower is better | 2nd / 8 | 3.67 s | +0.05 s |
| Snow HandlingLower is better | 2nd / 8 | 75.04 s | +0.42 s |
| Ice BrakingLower is better | 4th / 8 | 14 ft | +3 ft |
| Ice TractionLower is better | 4th / 8 | 2.18 s | +0.29 s |
| Ice HandlingLower is better | 3rd / 8 | 52.24 s | +1.01 s |
| Subj. NoiseHigher is better | 2nd / 8 | 4 Points | -1.00 Points |
| Fuel ConsumptionLower is better | 3rd / 8 | 5.69 l/100km | +0.03 l/100km |
- Origin
- Germany
Nokian Hakkapeliitta 9
205/60 R16 96T XL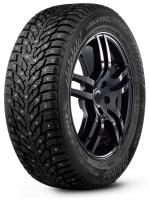
Category scores (% of best)
All discipline results (13)
Discipline positions compare the ranked tires in this test, not the whole market. These are individual measurements, not weighted overall scores.
| Test | Position in discipline | Result | Gap to best |
|---|---|---|---|
| Dry BrakingLower is better | 6th / 8 | 105 ft | +10 ft |
| Subj. Dry HandlingHigher is better | 3rd / 8 | 3 Points | -2.00 Points |
| Wet BrakingLower is better | 5th / 8 | 121 ft | +10 ft |
| Wet HandlingLower is better | 4th / 8 | 44.12 s | +1.01 s |
| Straight AquaHigher is better | 6th / 8 | 38.6 mph | -1.5 mph |
| Snow BrakingLower is better | 4th / 8 | 35 ft | +1 ft |
| Snow TractionLower is better | 5th / 8 | 3.75 s | +0.13 s |
| Snow HandlingLower is better | 1st / 8 | 74.62 s | Best in this discipline |
| Ice BrakingLower is better | 1st / 8 | 11 ft | Best in this discipline |
| Ice TractionLower is better | 2nd / 8 | 1.94 s | +0.05 s |
| Ice HandlingLower is better | 2nd / 8 | 51.4 s | +0.17 s |
| Subj. NoiseHigher is better | 5th / 8 | 2 Points | -3.00 Points |
| Fuel ConsumptionLower is better | 6th / 8 | 5.76 l/100km | +0.10 l/100km |
- Origin
- Finland
Hankook Winter i pike RS2
205/60 R16 96T XL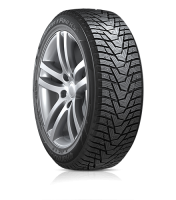
Category scores (% of best)
All discipline results (13)
Discipline positions compare the ranked tires in this test, not the whole market. These are individual measurements, not weighted overall scores.
| Test | Position in discipline | Result | Gap to best |
|---|---|---|---|
| Dry BrakingLower is better | 4th / 8 | 102 ft | +7 ft |
| Subj. Dry HandlingHigher is better | 3rd / 8 | 3 Points | -2.00 Points |
| Wet BrakingLower is better | 4th / 8 | 119 ft | +8 ft |
| Wet HandlingLower is better | 5th / 8 | 44.75 s | +1.64 s |
| Straight AquaHigher is better | 4th / 8 | 39.1 mph | -1.0 mph |
| Snow BrakingLower is better | 5th / 8 | 35 ft | +1 ft |
| Snow TractionLower is better | 6th / 8 | 3.79 s | +0.17 s |
| Snow HandlingLower is better | 3rd / 8 | 75.19 s | +0.57 s |
| Ice BrakingLower is better | 6th / 8 | 15 ft | +4 ft |
| Ice TractionLower is better | 3rd / 8 | 2.08 s | +0.19 s |
| Ice HandlingLower is better | 4th / 8 | 53.52 s | +2.29 s |
| Subj. NoiseHigher is better | 3rd / 8 | 3 Points | -2.00 Points |
| Fuel ConsumptionLower is better | 2nd / 8 | 5.67 l/100km | +0.01 l/100km |
- Origin
- South Korea
Pirelli Ice Zero 2
205/60 R16 96T XL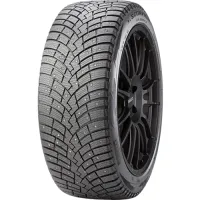
Category scores (% of best)
All discipline results (13)
Discipline positions compare the ranked tires in this test, not the whole market. These are individual measurements, not weighted overall scores.
| Test | Position in discipline | Result | Gap to best |
|---|---|---|---|
| Dry BrakingLower is better | 3rd / 8 | 102 ft | +7 ft |
| Subj. Dry HandlingHigher is better | 2nd / 8 | 4 Points | -1.00 Points |
| Wet BrakingLower is better | 2nd / 8 | 114 ft | +3 ft |
| Wet HandlingLower is better | 3rd / 8 | 44.1 s | +0.99 s |
| Straight AquaHigher is better | 1st / 8 | 40.1 mph | Best in this discipline |
| Snow BrakingLower is better | 6th / 8 | 35 ft | +1 ft |
| Snow TractionLower is better | 1st / 8 | 3.62 s | Best in this discipline |
| Snow HandlingLower is better | 6th / 8 | 75.74 s | +1.12 s |
| Ice BrakingLower is better | 7th / 8 | 17 ft | +6 ft |
| Ice TractionLower is better | 6th / 8 | 2.42 s | +0.53 s |
| Ice HandlingLower is better | 6th / 8 | 56.42 s | +5.19 s |
| Subj. NoiseHigher is better | 3rd / 8 | 3 Points | -2.00 Points |
| Fuel ConsumptionLower is better | 4th / 8 | 5.71 l/100km | +0.05 l/100km |
- Origin
- Russia
Nokian Nordman 7
205/60 R16 96T XL
Category scores (% of best)
All discipline results (13)
Discipline positions compare the ranked tires in this test, not the whole market. These are individual measurements, not weighted overall scores.
| Test | Position in discipline | Result | Gap to best |
|---|---|---|---|
| Dry BrakingLower is better | 8th / 8 | 109 ft | +14 ft |
| Subj. Dry HandlingHigher is better | 7th / 8 | 2 Points | -3.00 Points |
| Wet BrakingLower is better | 8th / 8 | 128 ft | +17 ft |
| Wet HandlingLower is better | 7th / 8 | 45.75 s | +2.64 s |
| Straight AquaHigher is better | 7th / 8 | 38.3 mph | -1.8 mph |
| Snow BrakingLower is better | 3rd / 8 | 34 ft | 0 ft |
| Snow TractionLower is better | 4th / 8 | 3.72 s | +0.10 s |
| Snow HandlingLower is better | 3rd / 8 | 75.19 s | +0.57 s |
| Ice BrakingLower is better | 5th / 8 | 14 ft | +3 ft |
| Ice TractionLower is better | 5th / 8 | 2.22 s | +0.33 s |
| Ice HandlingLower is better | 5th / 8 | 55.11 s | +3.88 s |
| Subj. NoiseHigher is better | 5th / 8 | 2 Points | -3.00 Points |
| Fuel ConsumptionLower is better | 5th / 8 | 5.74 l/100km | +0.08 l/100km |
- Origin
- Russia
Toyo Observe Ice Freezer
205/60 R16 96T XL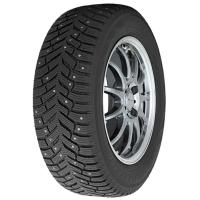
Category scores (% of best)
All discipline results (13)
Discipline positions compare the ranked tires in this test, not the whole market. These are individual measurements, not weighted overall scores.
| Test | Position in discipline | Result | Gap to best |
|---|---|---|---|
| Dry BrakingLower is better | 5th / 8 | 104 ft | +9 ft |
| Subj. Dry HandlingHigher is better | 3rd / 8 | 3 Points | -2.00 Points |
| Wet BrakingLower is better | 7th / 8 | 122 ft | +11 ft |
| Wet HandlingLower is better | 6th / 8 | 45.17 s | +2.06 s |
| Straight AquaHigher is better | 5th / 8 | 38.8 mph | -1.3 mph |
| Snow BrakingLower is better | 6th / 8 | 35 ft | +1 ft |
| Snow TractionLower is better | 8th / 8 | 3.92 s | +0.30 s |
| Snow HandlingLower is better | 7th / 8 | 76.85 s | +2.23 s |
| Ice BrakingLower is better | 3rd / 8 | 13 ft | +2 ft |
| Ice TractionLower is better | 7th / 8 | 2.8 s | +0.91 s |
| Ice HandlingLower is better | 7th / 8 | 59.02 s | +7.79 s |
| Subj. NoiseHigher is better | 5th / 8 | 2 Points | -3.00 Points |
| Fuel ConsumptionLower is better | 6th / 8 | 5.76 l/100km | +0.10 l/100km |
- Origin
- Malaysia
GT Radial IcePro 3
205/60 R16 96T XL
Category scores (% of best)
All discipline results (13)
Discipline positions compare the ranked tires in this test, not the whole market. These are individual measurements, not weighted overall scores.
| Test | Position in discipline | Result | Gap to best |
|---|---|---|---|
| Dry BrakingLower is better | 1st / 8 | 95 ft | Best in this discipline |
| Subj. Dry HandlingHigher is better | 7th / 8 | 2 Points | -3.00 Points |
| Wet BrakingLower is better | 1st / 8 | 111 ft | Best in this discipline |
| Wet HandlingLower is better | 1st / 8 | 43.11 s | Best in this discipline |
| Straight AquaHigher is better | 2nd / 8 | 39.8 mph | -0.3 mph |
| Snow BrakingLower is better | 8th / 8 | 35 ft | +1 ft |
| Snow TractionLower is better | 7th / 8 | 3.83 s | +0.21 s |
| Snow HandlingLower is better | 8th / 8 | 78.81 s | +4.19 s |
| Ice BrakingLower is better | 8th / 8 | 17 ft | +6 ft |
| Ice TractionLower is better | 8th / 8 | 3.29 s | +1.40 s |
| Ice HandlingLower is better | 8th / 8 | 61.42 s | +10.19 s |
| Subj. NoiseHigher is better | 5th / 8 | 2 Points | -3.00 Points |
| Fuel ConsumptionLower is better | 8th / 8 | 5.78 l/100km | +0.12 l/100km |
- Origin
- China
Discussion