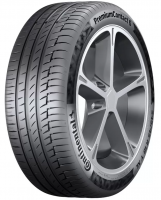
Test Charts / Gute Fahrt
2020 Gute Fahrt SUV Summer Tire Test
Compare each discipline in the tested size. See the measured result, position and gap to the best tire, then read the verdict for the trade-offs behind the finishing order.
- Tested size
- 215/50 R18
- Tires tested
- 8
- Disciplines
- 9

Read the measurements, not just the rank
Lower is better for braking distances and lap times; higher is better for subjective scores and aquaplaning speed. Bars start at zero. Read the gap alongside the position: adjacent tires can be separated by very different margins.
Positions and gaps always refer to the full test field within each group. Selecting tires does not recalculate rankings or change the best-in-test benchmark.
Focus on your tires
Select tires to highlight them throughout the charts.
Positions and gaps always refer to the full test field within each group. Selecting tires does not recalculate rankings or change the best-in-test benchmark.
Dry
2Dry Braking
Dry braking in feet
Lower is better ↓| Position / Tire | Result | Gap to best |
|---|---|---|
| 115 ft | Best | |
| 115 ft | 0 ft | |
| 117 ft | +2 ft | |
| 117 ft | +2 ft | |
| 124 ft | +9 ft | |
| 124 ft | +9 ft | |
| 124 ft | +9 ft | |
| 125 ft | +10 ft |
The difference between best and worst was 8.8% (10 ft ≈ 0.7 Car Lengths).
Subj. Dry Handling
Subjective Dry Handling Score
Higher is better ↑| Position / Tire | Result | Gap to best |
|---|---|---|
| 3 Points | Best | |
| 3 Points | Best | |
| 3 Points | Best | |
| 2 Points | -1.00 Points | |
| 2 Points | -1.00 Points | |
| 2 Points | -1.00 Points | |
| 1 Points | -2.00 Points | |
| 1 Points | -2.00 Points |
The difference between best and worst was 66.7% (2 Points).

Wet
4Wet Braking
Wet braking in feet
Lower is better ↓| Position / Tire | Result | Gap to best |
|---|---|---|
| 127 ft | Best | |
| 127 ft | 0 ft | |
| 128 ft | +1 ft | |
| 129 ft | +2 ft | |
| 130 ft | +3 ft | |
| 131 ft | +4 ft | |
| 133 ft | +6 ft | |
| 136 ft | +9 ft |
The difference between best and worst was 7.3% (9 ft ≈ 0.6 Car Lengths).
Subj. Wet Handling
Subjective Wet Handling Score
Higher is better ↑| Position / Tire | Result | Gap to best |
|---|---|---|
| 3 Points | Best | |
| 3 Points | Best | |
| 2 Points | -1.00 Points | |
| 2 Points | -1.00 Points | |
| 2 Points | -1.00 Points | |
| 1 Points | -2.00 Points | |
| 1 Points | -2.00 Points | |
| 1 Points | -2.00 Points |
The difference between best and worst was 66.7% (2 Points).
Wet Circle
Lateral wet grip in m/s squared
Higher is better ↑| Position / Tire | Result | Gap to best |
|---|---|---|
| 18.1 mph | Best | |
| 17.8 mph | -0.3 mph | |
| 17.6 mph | -0.5 mph | |
| 17.4 mph | -0.7 mph | |
| 17.3 mph | -0.8 mph | |
| 16.9 mph | -1.2 mph | |
| 16.7 mph | -1.4 mph | |
| 16.3 mph | -1.8 mph |
The difference between best and worst was 9.9% (1.8 mph).
Straight Aqua
Float Speed in mph
Higher is better ↑| Position / Tire | Result | Gap to best |
|---|---|---|
| 48.7 mph | Best | |
| 48.3 mph | -0.4 mph | |
| 48.0 mph | -0.7 mph | |
| 47.9 mph | -0.8 mph | |
| 47.9 mph | -0.8 mph | |
| 47.8 mph | -0.9 mph | |
| 47.3 mph | -1.4 mph | |
| 45.9 mph | -2.8 mph |
The difference between best and worst was 5.7% (2.8 mph).
Comfort
2Subj. Comfort
Subjective Comfort Score
Higher is better ↑| Position / Tire | Result | Gap to best |
|---|---|---|
| 3 Points | Best | |
| 3 Points | Best | |
| 3 Points | Best | |
| 2 Points | -1.00 Points | |
| 2 Points | -1.00 Points | |
| 2 Points | -1.00 Points | |
| 2 Points | -1.00 Points | |
| 2 Points | -1.00 Points |
The difference between best and worst was 33.3% (1 Points).
Subj. Noise
Subjective in car noise levels
Higher is better ↑| Position / Tire | Result | Gap to best |
|---|---|---|
| 3 Points | Best | |
| 3 Points | Best | |
| 3 Points | Best | |
| 2 Points | -1.00 Points | |
| 2 Points | -1.00 Points | |
| 2 Points | -1.00 Points | |
| 2 Points | -1.00 Points | |
| 2 Points | -1.00 Points |
The difference between best and worst was 33.3% (1 Points).
Value
1Rolling Resistance
Rolling resistance in kg t
Lower is better ↓| Position / Tire | Result | Gap to best | Extra fuel / year |
|---|---|---|---|
| 0.97 kg/t | Best | $0 | |
| 1 kg/t | +0.03 kg/t | $9 | |
| 1.01 kg/t | +0.04 kg/t | $12 | |
| 1.03 kg/t | +0.06 kg/t | $18 | |
| 1.05 kg/t | +0.08 kg/t | $24 | |
| 1.15 kg/t | +0.18 kg/t | $55 | |
| 1.16 kg/t | +0.19 kg/t | $58 | |
| 1.2 kg/t | +0.23 kg/t | $70 |
The difference between best and worst was 23.7% (0.23 kg / t). Over 12,000 miles a year at $3.60/gal, the Toyo Proxes CF2 SUV uses about 19 gal ($70) more fuel than the Nokian WetProof.
Adjust the assumptions
Calculated estimates, not additional measurements. Use the controls to explore the assumptions. These calculators use the full test field, independently of your tire selection above.
More tire tests
Cross-check this test
Where these tires were tested again, and how the verdict held up.
2019 AMS Summer SUV Tire Test
215/55 R1711 tires tested
3 of these 8 tires tested again
2021 Camper Van / SUV Tire Test
235/55 R178 tires tested
2 of these 8 tires tested again
2020 New 17 Inch Summer Tire Test
225/45 R1710 tires tested
2 of these 8 tires tested again