



This is the most in-depth all-terrain tire test I have ever put together. It took nearly a year, involved snow and ice testing in Northern Europe, wet and dry testing in Central Europe, and dirt testing in Utah, all to work out where the newest aggressive all-terrain tires are good, and where the compromises are.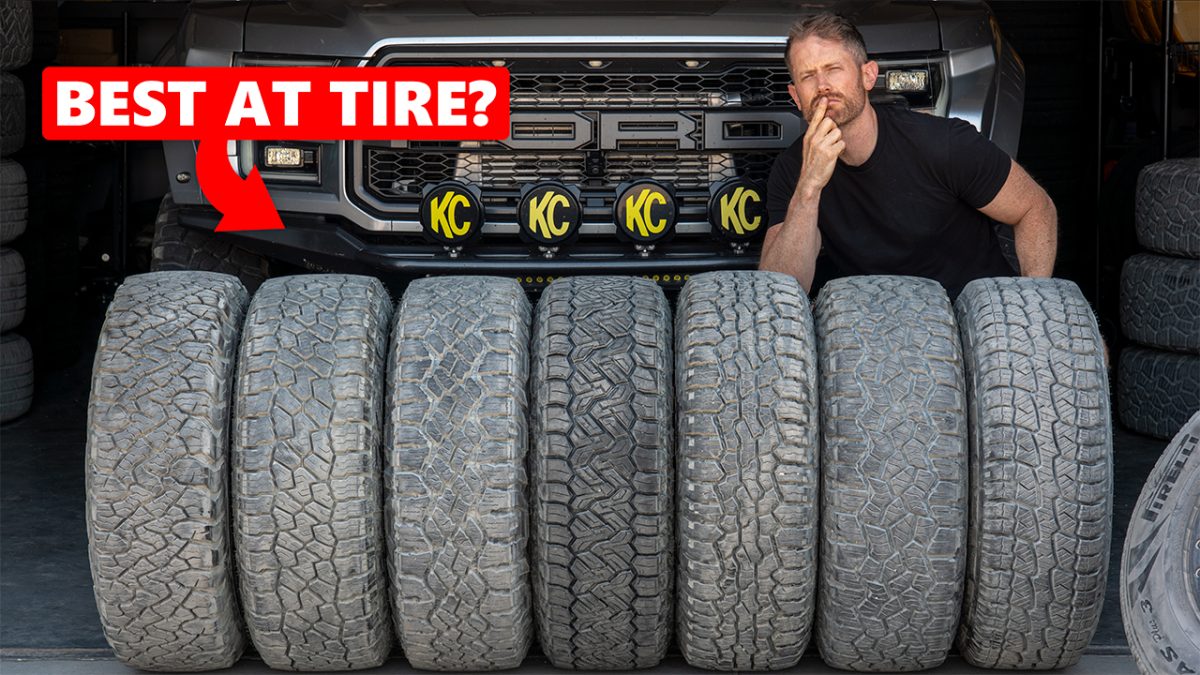
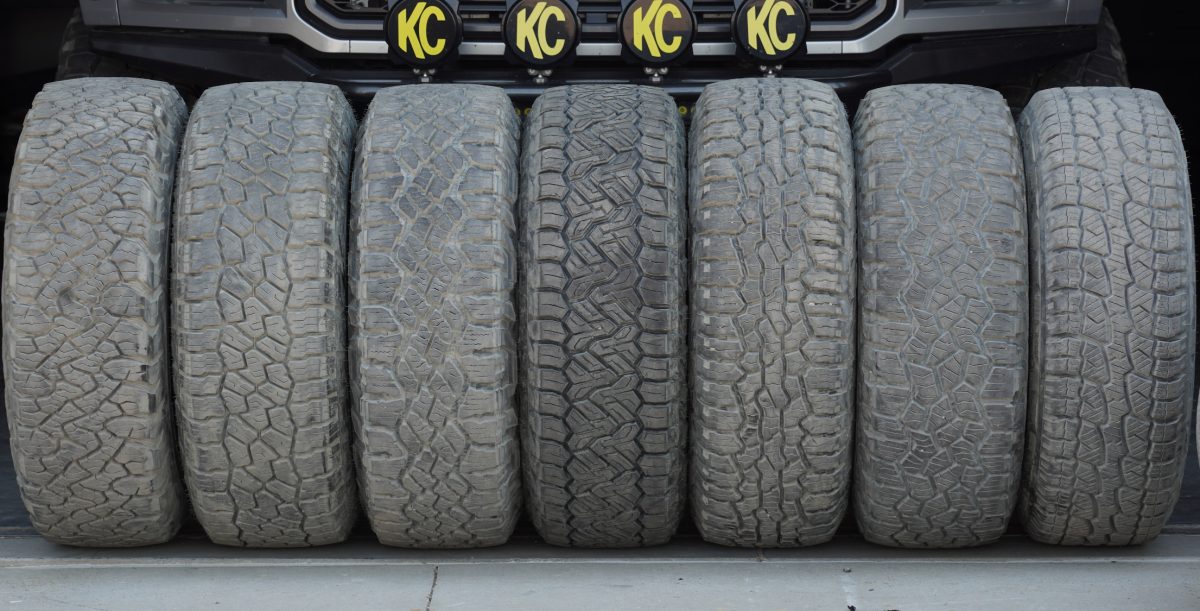
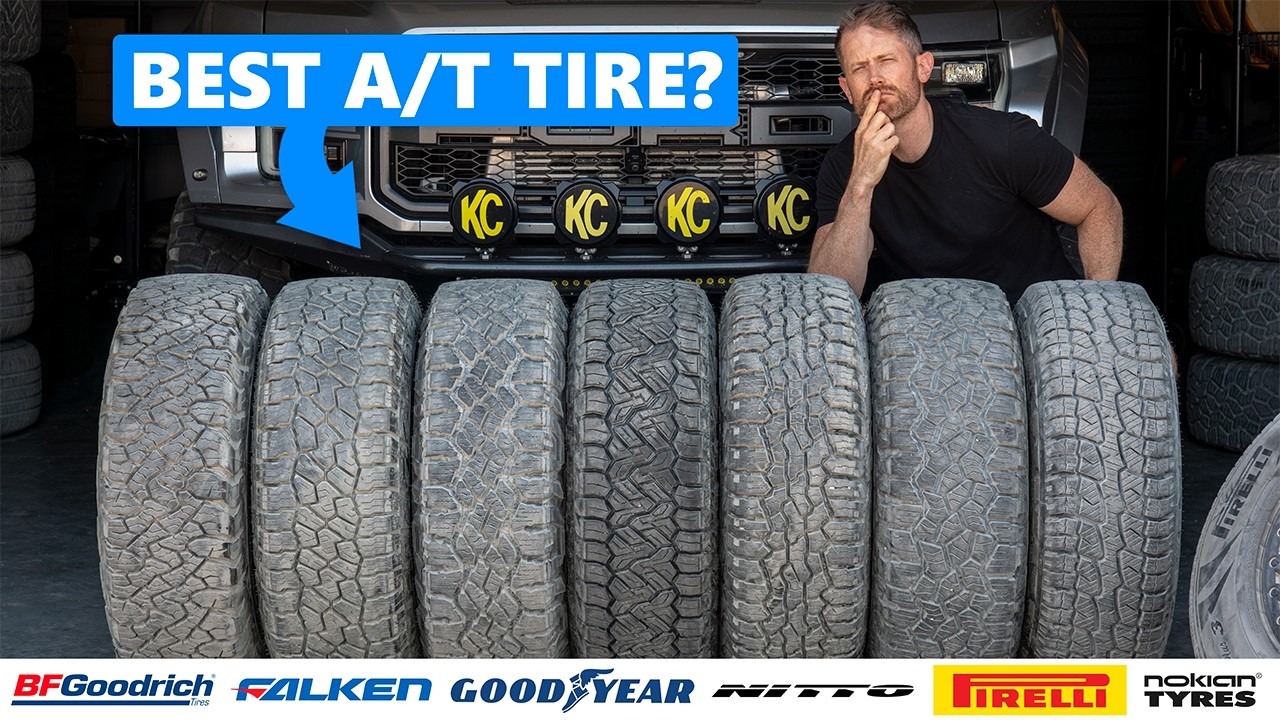
The size was 265/70 R17 and the main vehicle was a Ford Ranger Raptor. I tested seven all-terrain tires - six of the newer, more aggressive options plus the milder budget Westlake - and I also included the Pirelli Scorpion AS Plus 3 as an all-season reference tire. That reference tire is not here because I think you should use it for serious off-roading. It is here because it shows exactly what you gain and lose when you move from a road-biased all-season to a proper all-terrain.
One other important point: for this test I ran the exact same set of tires through every test, starting with snow and finishing with dirt. Usually I would have multiple sets for different surfaces, but for this one I wanted to see the complete picture from the same tires. As always with off-road testing, track evolution is the awkward bit, so where the data needs context, I will give it.
Test setup & methodology
The test setting, the conditions recorded and how the results contribute to the score.
Show full testing methodology
Recorded test conditions
- Dry Braking
- 62.1 → 6.2 mph · 57–63 °F
- Wet Braking
- 49.7 → 6.2 mph · 54–59 °F
- Wet Handling
- 50–54 °F
- Snow Braking
- 18.6 → 6.2 mph · 21–25 °F
- Snow Traction
- 3.1 → 21.7 mph · 21–25 °F
- Snow Handling
- 27–28 °F
Score Weighting
Weights express the scoring priorities, not how much each discipline actually changed the finishing order. The size of the performance gaps matters too. Category weights contribute to the overall score. Within each category, discipline weights divide that category’s share. Published finishing positions also need to be read alongside the editorial verdict.
| Test | Within category | Share of overall score |
|---|---|---|
| Dry · 30% | ||
| Dry Braking | 75% | 22.5% |
| Subj. Dry Handling | 25% | 7.5% |
| Wet · 35% | ||
| Wet Braking | 50% | 17.5% |
| Wet Handling | 30% | 10.5% |
| Subj. Wet Handling | 10% | 3.5% |
| Straight Aqua | 10% | 3.5% |
| Off road · 12.5% | ||
| Dirt Handling | 50% | 6.25% |
| Subj. Dirt Handling | 50% | 6.25% |
| Snow · 10% | ||
| Snow Braking | 35% | 3.5% |
| Snow Traction | 35% | 3.5% |
| Snow Handling | 20% | 2% |
| Subj. Snow Handling | 10% | 1% |
| Comfort · 10% | ||
| Subj. Comfort | 50% | 5% |
| Subj. Noise | 25% | 2.5% |
| Noise | 25% | 2.5% |
| Value · 2.5% | ||
| Value | 100% | 2.5% |
Our standard methods
The conditions above are recorded for this test. The descriptions below explain our standard procedures; measurement windows and run counts can vary by test.
Dry Braking
For dry braking, I drive the test vehicle at an entry speed of 110 km/h and apply full braking effort to a standstill with ABS active on clean, dry asphalt. I typically use an 100–5 km/h measurement window. My standard programme is five runs per tire set where possible, although the sequence can extend to as many as fifteen runs if conditions and tire category justify it. I analyze the full set of runs and discard statistical outliers before averaging. Reference tires are run repeatedly throughout the session to correct for changing conditions.
Subj. Dry Handling
I also carry out a structured subjective handling assessment at the limit of adhesion on a dedicated dry handling circuit. I score steering precision, steering response, turn-in behavior, mid-corner balance, corner-exit traction, breakaway characteristics, and overall confidence using a standardised 1–10 scale used consistently across my testing. The final assessment combines numeric scoring with written technical commentary. I complete familiarisation laps on the control tire before evaluating each candidate.
Wet Braking
For wet braking, I drive the test vehicle at an entry speed of 88 km/h and apply full braking effort to a standstill with ABS active on an asphalt surface with a controlled water film. I typically use an 80–5 km/h measurement window to isolate tire performance from variability in the initial brake application. My standard programme is eight runs per tire set where possible, although the sequence can extend to as many as fifteen runs if conditions and tire category justify it. I analyze the full set of runs and discard statistical outliers before averaging. To correct for changing conditions, I run reference tires repeatedly throughout the session — in wet testing, typically every three candidate test sets.
Wet Handling
For wet handling, I drive at the limit of adhesion around a dedicated handling circuit. I generally use specialist wet circuits with kerb-watering systems designed to maintain a consistent surface condition. ESC is disabled where possible so I can assess the tire's natural balance, transient response, and limit behavior without electronic intervention masking the result. I usually complete between two and five timed laps per tire set, depending on the circuit, tire type, and consistency of conditions. I exclude laps affected by clear driver error or obvious environmental inconsistency. Control runs are carried out frequently throughout the session, and I often use multiple sets of control tires so that wear on the references does not become a meaningful variable.
Subj. Wet Handling
I also carry out a structured subjective handling assessment at the limit of adhesion on a dedicated wet handling circuit. I score steering precision, steering response, turn-in behavior, mid-corner balance, aquaplaning resistance, breakaway characteristics, and overall confidence using a standardised 1–10 scale used consistently across my testing. The final assessment combines numeric scoring with written technical commentary. I complete familiarisation laps on the control tire before evaluating each candidate.
Straight Aqua
To measure straight-line aquaplaning resistance, I drive one side of the vehicle through a water trough of controlled depth, typically around 7 mm, while the opposite side remains on dry pavement. I enter at a fixed speed and then accelerate progressively. I define aquaplaning onset as the point at which the wheel travelling through the water exceeds a specified slip threshold relative to the dry-side reference wheel. I usually perform four runs per tire set and average the valid results.
Snow Braking
For snow braking, I drive the test vehicle at an entry speed of 50 km/h and apply full braking effort to a standstill with ABS active on a groomed, compacted snow surface, measuring 45-5 km/h. I generally use a wide VDA (vehicle dynamic area) and progressively move across the surface between runs so that no tire ever brakes on the same piece of snow twice. My standard programme is twelve runs per tire set, although the sequence can extend further if the data justify it. I analyze the full set of runs and discard statistical outliers before averaging. The surface is regularly groomed throughout the session. To correct for changing snow surface conditions, I run reference tires repeatedly — typically every two candidate test sets.
Snow Traction
For snow traction, I accelerate the vehicle from rest on a groomed snow surface with traction control active and measure speed and time using GPS telemetry. I typically use a 5–35 km/h measurement window to reduce the influence of launch transients and powertrain irregularities. I use a wide VDA (vehicle dynamic area) and progressively move across the surface between runs so that no tire ever accelerates on the same piece of snow twice. The surface is regularly groomed throughout the session. I complete multiple runs per tire set and average the valid results. Reference tires are run typically every two candidate test sets to correct for changing snow surface conditions.
Snow Handling
For snow handling, I drive at the limit of adhesion around a dedicated snow handling circuit with ESC disabled where possible. The circuit is groomed and prepared after every run while tires are being changed, so each set runs on a consistently prepared surface. I usually complete between two and five timed laps per tire set, excluding laps affected by clear driver error or obvious environmental inconsistency. Because snow surfaces degrade more rapidly than asphalt, control runs are carried out more frequently — typically every two candidate test sets.
Subj. Snow Handling
I also carry out a structured subjective handling assessment at the limit of adhesion on a dedicated snow handling circuit. The circuit is groomed and prepared after every run while tires are being changed, so each set runs on a consistently prepared surface. I score steering precision, turn-in behavior, mid-corner balance, corner-exit traction, breakaway characteristics, and overall confidence on snow using a standardised 1–10 scale used consistently across my testing. The final assessment combines numeric scoring with written technical commentary. I complete familiarisation laps on the control tire before evaluating each candidate.
Dirt Handling
For dirt handling, I drive at the limit of adhesion around a dedicated dirt handling course with ESC typically disabled. I complete multiple timed laps per tire set, excluding laps affected by driver error or environmental inconsistency. Because natural surfaces are inherently variable, I place particular emphasis on repeat runs, careful reference tracking, and averaged results. The control tire is retested at regular intervals.
Subj. Dirt Handling
I also carry out a structured subjective handling assessment on a dedicated dirt course. I score steering feel, traction, stability, breakaway characteristics, and overall confidence using a standardised 1–10 scale used consistently across my testing. The final assessment combines numeric scoring with written technical commentary. I complete familiarisation laps on the control tire before evaluating each candidate.
Subj. Comfort
To assess comfort, I drive on a wide range of road surfaces (often dedicated comfort tracks at test facilities) at speeds from 50 to 120 km/h, including smooth motorway, coarse surfaces, expansion joints, broken pavement, and sharp-edged obstacles. I evaluate primary ride quality, secondary ride quality, impact harshness, seat-transmitted vibration, and the tire's ability to absorb sharp inputs. Ratings are assigned on a 1–10 scale relative to the reference tire.
Subj. Noise
For subjective noise assessment, I drive at constant speeds across multiple surface types with the windows closed, ventilation off, and audio system off. I assess overall noise level, tonal quality, cavity boom, pattern noise, broadband roar, and sensitivity to both speed and road texture. Each tire is rated on a 1–10 scale and supported by written observations on noise character and annoyance.
Noise
For cabin noise assessment, I drive at controlled speeds, typically 50, 80, 100, and 120 km/h, on NVH test surfaces with defined texture characteristics. Calibrated microphones are positioned at ear height within the cabin. Measurements are taken using A-weighting, with one-third octave analysis where required to identify tonal features such as cavity resonance. Windows remain closed, ventilation is off, and ambient conditions are controlled so the data reflects the tire rather than external interference.
Rolling Resistance
Rolling resistance is measured under controlled laboratory conditions in accordance with ISO 28580 and UNECE Regulation 117 Annex 6. The tire is mounted on a test wheel and loaded against a large-diameter steel drum. After thermal stabilisation at the prescribed test speed, rolling resistance force is measured at the spindle and corrected according to the relevant procedure. The result is expressed as rolling resistance coefficient, typically in kg/tonne.
Off road - dirt handling
I started with dirt because it is the most fun, and because you can really feel the differences in tread pattern, carcass and compound. It is also one of the hardest things to test because every lap changes the surface slightly. The timed result was very close: the Pirelli Scorpion XTM AT was quickest at 74.05s and the Nitto Recon Grappler AT was last at 75.59s, so the entire field was covered by 1.54s.
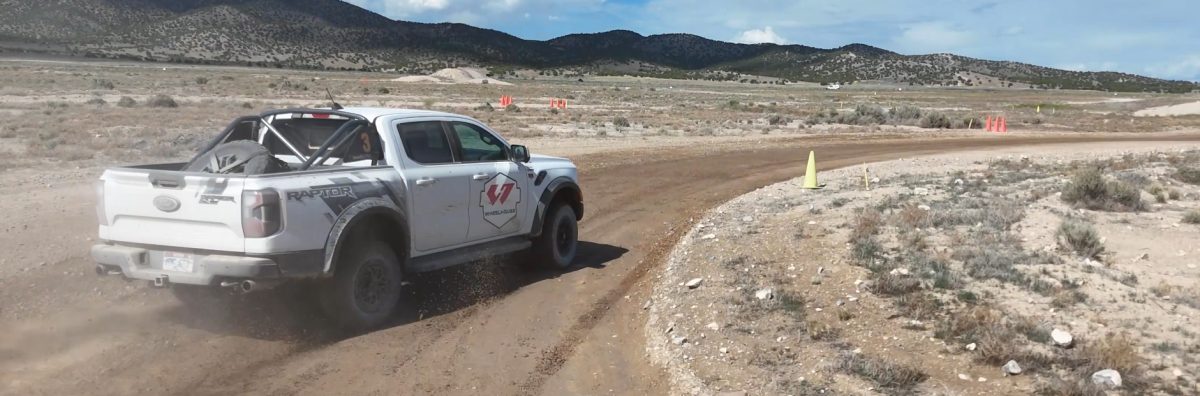
The Pirelli Scorpion AS Plus 3 all-season reference was second at 74.56s, which will annoy some people, but it makes sense on this type of hard and mixed dirt surface. If the tire can get down to something firm, the road tire has good compound grip and a lighter, more compliant carcass. It was not as good in the fluffy sections, and it took longer to recover once sliding, but the lap time was real. The Goodyear was third at 74.68s, the BFGoodrich fourth at 74.87s, the Falken fifth at 75.18s, the Westlake sixth at 75.35s and the Nokian seventh at 75.43s. The Nokian being seventh on time but one of my favorites to drive is a useful reminder that dirt lap times need some care.
Dirt Handling
Dirt handling time in seconds
Lower is better ↓| Position / Tire | Result | Gap to best |
|---|---|---|
| 74.05 s | Best | |
RefPirelli Scorpion AS Plus 3 |
74.56 s | +0.51 s |
| 74.68 s | +0.63 s | |
| 74.87 s | +0.82 s | |
| 75.18 s | +1.13 s | |
| 75.35 s | +1.30 s | |
| 75.43 s | +1.38 s | |
| 75.59 s | +1.54 s |
All the tires in the Dirt Handling test finished less than 3% apart.
The subjective dirt scores tell the story closer to how it felt from the seat. The Pirelli Scorpion XTM AT was best at 8.6 Points, just ahead of the Nokian Outpost nAT on 8.5 Points. My co-driver actually preferred the Nokian, and I can see why. Both tires had an even grip circle, good recovery and enough bite when the surface got loose.
The BFGoodrich was next at 8.4 Points. It felt strong on the brakes and the carcass worked the ruts well, even if it still stopped and accelerated slightly better than it turned. The Goodyear, Falken and all-season reference all scored 8.3 Points, but they got there in different ways. The Goodyear had good grip but a slightly stiff carcass in the bumps, the Falken felt solid but needed more steering lock, and the all-season had great compound grip on the polished parts but less purchase in the fluffy dirt. The Nitto scored 8.1 Points because it braked well but had less lateral support, while the Westlake was last at 7.9 Points because the carcass did not give enough stability and slides took too long to recover.
Subj. Dirt Handling
Subjective Dirt Handling Score
Higher is better ↑| Position / Tire | Result | Gap to best |
|---|---|---|
| 8.6 Points | Best | |
| 8.5 Points | -0.10 Points | |
| 8.4 Points | -0.20 Points | |
RefPirelli Scorpion AS Plus 3 |
8.3 Points | -0.30 Points |
| 8.3 Points | -0.30 Points | |
| 8.3 Points | -0.30 Points | |
| 8.1 Points | -0.50 Points | |
| 7.9 Points | -0.70 Points |
The difference between best and worst was 8.1% (0.7 Points).
Wet handling
For wet I used the Ranger Raptor in rear-wheel drive, manual sport mode and with the driver aids as off as possible, because that gives a much clearer idea of tire balance. I also used the Westlake as one of my reference repeats, and I was glad I did because it was far better in the wet than I expected.
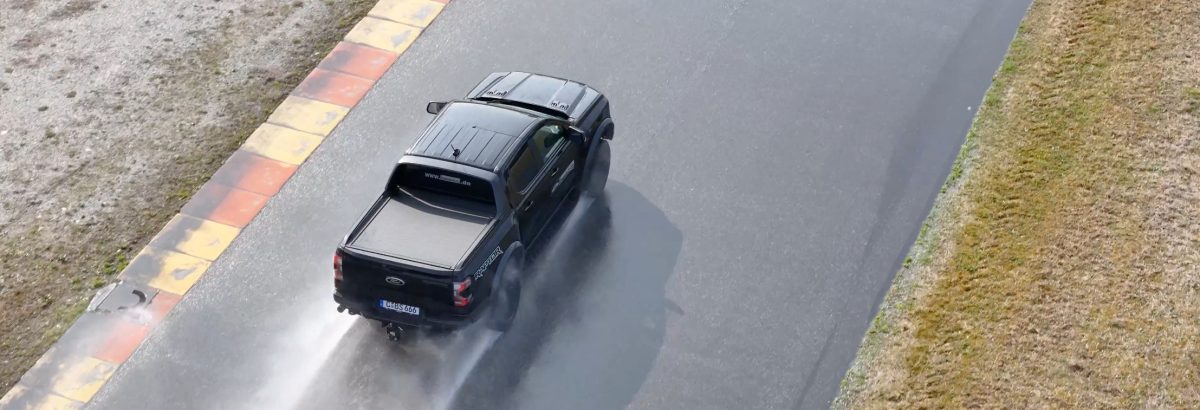
The fastest tire overall was the Pirelli Scorpion AS Plus 3 all-season reference at 117.67s. It felt softer in steering than the best all-terrain, but once it was loaded in the longer corners it just kept gripping. The best all-terrain was the Pirelli Scorpion XTM AT at 119.98s, only 2.31s behind the reference all-season, and this tire transformed the truck. It turned harder, braked better, and gave much more detail at the limit than the rest of the all-terrain group.
The Westlake was third at 124.12s, which is a very good result for the budget, milder all-terrain. Then came the close middle group: Nokian at 129.07s, BFGoodrich at 129.16s and Goodyear at 129.7s. The differences between those three were more about feel than time. The Falken was seventh at 131.17s and the Nitto was last at 133.82s. The Nitto was the one I would avoid for regular wet-road use, because it was not just slow, it was peaky and unpredictable when the rear started to slide.
Wet Handling
Wet handling time in seconds [Average Temperature 52°F]
Lower is better ↓| Position / Tire | Result | Gap to best |
|---|---|---|
RefPirelli Scorpion AS Plus 3 |
117.67 s | -2.31 s |
| 119.98 s | Best | |
| 124.12 s | +4.14 s | |
| 129.07 s | +9.09 s | |
| 129.16 s | +9.18 s | |
| 129.7 s | +9.72 s | |
| 131.17 s | +11.19 s | |
| 133.82 s | +13.84 s |
The difference between best and worst was 13.7% (16.15 s).
Wet braking
Wet braking is one of the most important results in this whole test because this is where a tire can really save you distance on the road. The all-season reference was best at 110ft, which is exactly why I included it. Among the all-terrains, the Pirelli Scorpion XTM AT was best at 117ft, followed by the Westlake at 122ft. That is a strong result from both, but it also shows the road-tire advantage the reference still has.
The BFGoodrich was fourth overall at 132ft, ahead of the Goodyear at 136ft, Nokian at 139ft and Falken at 139ft. The Nitto was last at 149ft, 39ft behind the best overall result, which is a lot of extra distance when you need to stop in the wet.
Wet Braking
Wet braking in feet (50 - 6 mph) [Average Temperature 56°F]
Lower is better ↓| Position / Tire | Result | Gap to best | Residual speed |
|---|---|---|---|
RefPirelli Scorpion AS Plus 3 |
110 ft | -7 ft | 0 mph |
| 117 ft | Best | 0 mph | |
| 122 ft | +5 ft | 16 mph | |
| 132 ft | +15 ft | 27 mph | |
| 136 ft | +19 ft | 30 mph | |
| 139 ft | +22 ft | 31 mph | |
| 139 ft | +22 ft | 32 mph | |
| 149 ft | +32 ft | 37 mph |
The difference between best and worst was 35.5% (39 ft ≈ 2.6 Car Lengths). From 80 mph, the Nitto Recon Grappler AT would still be travelling at 37 mph when the Pirelli Scorpion XTM AT had stopped.
Residual speed is calculated from the measured braking distances, assuming constant deceleration; it is not a separate measurement.
Straight aquaplaning
In the deeper water of straight aquaplaning, the Nokian Outpost nAT was best, the Westlake and the all-season reference were both at 63.5 mph, the BFGoodrich was 63.4 mph, the Pirelli Scorpion XTM AT was 63.1 mph and the Goodyear was 63.0 mph, so that group was tightly packed.
The Nitto was seventh and the Falken was last. The Falken being last in aquaplaning, last in the main snow tests, and down in wet handling is why I would be careful with it if winter and wet-road security are high on your list.
Straight Aqua
Float Speed in mph
Higher is better ↑| Position / Tire | Result | Gap to best |
|---|---|---|
| 65.7 mph | Best | |
| 63.5 mph | -2.2 mph | |
RefPirelli Scorpion AS Plus 3 |
63.5 mph | -2.2 mph |
| 63.4 mph | -2.3 mph | |
| 63.1 mph | -2.6 mph | |
| 63.0 mph | -2.7 mph | |
| 60.3 mph | -5.4 mph | |
| 59.3 mph | -6.4 mph |
The difference between best and worst was 9.8% (6.4 mph).
Dry performance
Dry braking
I did not spend as much time talking about dry performance in the video because the wet, snow and dirt results are the more interesting parts of an all-terrain test, but the dry numbers still matter. The Pirelli Scorpion AS Plus 3 reference was best at 132ft. Again, that is the road-tire advantage.
The Pirelli Scorpion XTM AT was the best all-terrain and second overall at 134ft, only 2ft behind the reference. After that there was a bigger step to the Falken at 145ft, then the Westlake at 148ft, Nitto at 148ft and Nokian at 149ft. The Goodyear was seventh at 152ft and the BFGoodrich was last at 154ft. I liked the KO3 in several areas, but last in dry braking is not ideal.
Dry Braking
Dry braking in feet (62 - 6 mph) [Average Temperature 60°F]
Lower is better ↓| Position / Tire | Result | Gap to best | Residual speed |
|---|---|---|---|
RefPirelli Scorpion AS Plus 3 |
132 ft | -2 ft | 0 mph |
| 134 ft | Best | 0 mph | |
| 145 ft | +11 ft | 21 mph | |
| 148 ft | +14 ft | 24 mph | |
| 148 ft | +14 ft | 25 mph | |
| 149 ft | +15 ft | 25 mph | |
| 152 ft | +18 ft | 27 mph | |
| 154 ft | +20 ft | 29 mph |
The difference between best and worst was 16.8% (22 ft ≈ 1.5 Car Lengths). From 80 mph, the BFGoodrich All Terrain TA KO3 would still be travelling at 29 mph when the Pirelli Scorpion XTM AT had stopped.
Residual speed is calculated from the measured braking distances, assuming constant deceleration; it is not a separate measurement.

Road comfort and noise
Subjective comfort
Noise and comfort matter a lot in this category, so two of us spent a full day driving the Ranger Raptor around roads in Utah. The all-season reference was the comfort benchmark at 11 Points. It felt lighter over impacts, had better steering phase and generally made the truck feel less heavy on its feet.
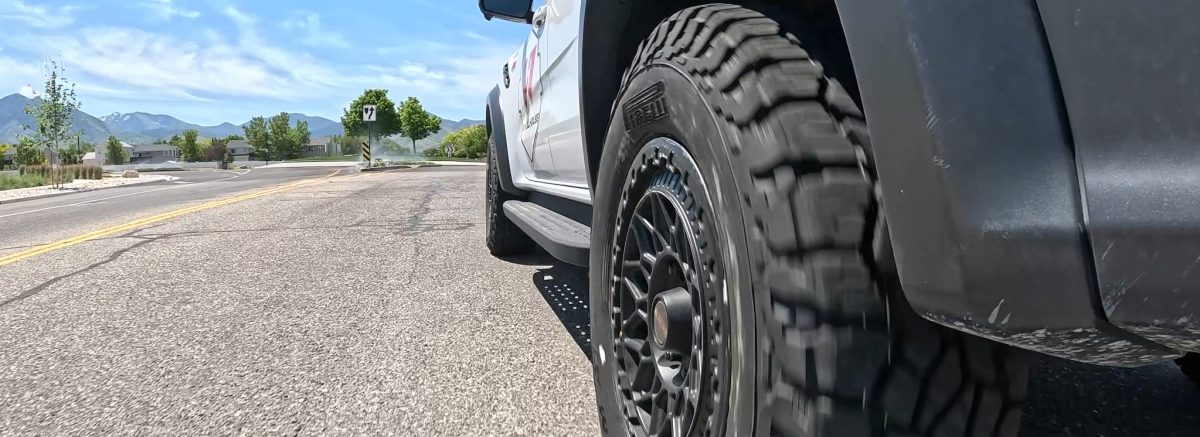
Among the all-terrains, the Nokian and BFGoodrich both scored 10 Points. The BFGoodrich probably had the plushest ride, rounding off impacts nicely, while the Nokian was the best overall road package because it combined comfort, steering and noise so well. The Pirelli Scorpion XTM AT was firmer, but very well damped and much nicer to steer.
Subj. Comfort
Subjective Comfort Score
Higher is better ↑| Position / Tire | Result | Gap to best |
|---|---|---|
RefPirelli Scorpion AS Plus 3 |
11 Points | +1.00 Points |
| 10 Points | Best | |
| 10 Points | Best | |
| 9.5 Points | -0.50 Points | |
| 9 Points | -1.00 Points | |
| 8.75 Points | -1.25 Points | |
| 8 Points | -2.00 Points | |
| 7 Points | -3.00 Points |
The difference between best and worst was 36.4% (4 Points).
Subjective noise
Subjective noise is where pitch matters as much as volume. The Nokian and the all-season reference both scored 10 Points, with the Nokian ranked first among the all-terrains. It did not have one single magic trick, it just avoided annoying you on almost every road surface.
The BFGoodrich scored 9.5 Points, which matches my road notes because on normal road surfaces it was not far from the reference tire, even if it was heavier and slower to react. The Pirelli Scorpion XTM AT scored 9 Points, the Goodyear and Falken both scored 8.5 Points, and the Nitto scored 7 Points with a more traditional all-terrain hum. The Westlake was last at 6 Points. Its measured noise was low, but the pitch was annoying, especially at speed, and that is exactly why we do both measured and subjective noise.
Subj. Noise
Subjective in car noise levels
Higher is better ↑| Position / Tire | Result | Gap to best |
|---|---|---|
RefPirelli Scorpion AS Plus 3 |
10 Points | 0.00 Points |
| 10 Points | Best | |
| 9.5 Points | -0.50 Points | |
| 9 Points | -1.00 Points | |
| 8.5 Points | -1.50 Points | |
| 8.5 Points | -1.50 Points | |
| 7 Points | -3.00 Points | |
| 6 Points | -4.00 Points |
The difference between best and worst was 40% (4 Points).
Snow handling
I will be doing a more detailed snow video, but here is the short version. We ran snow handling on more than one loop, including rear-wheel drive and all-wheel drive running, because the Ranger Raptor is good enough to show balance as well as grip. The tracks were icy in places and quite rutty, so it was not a perfect surface, but I was happy with the consistency and how the results lined up with the braking and traction tests.
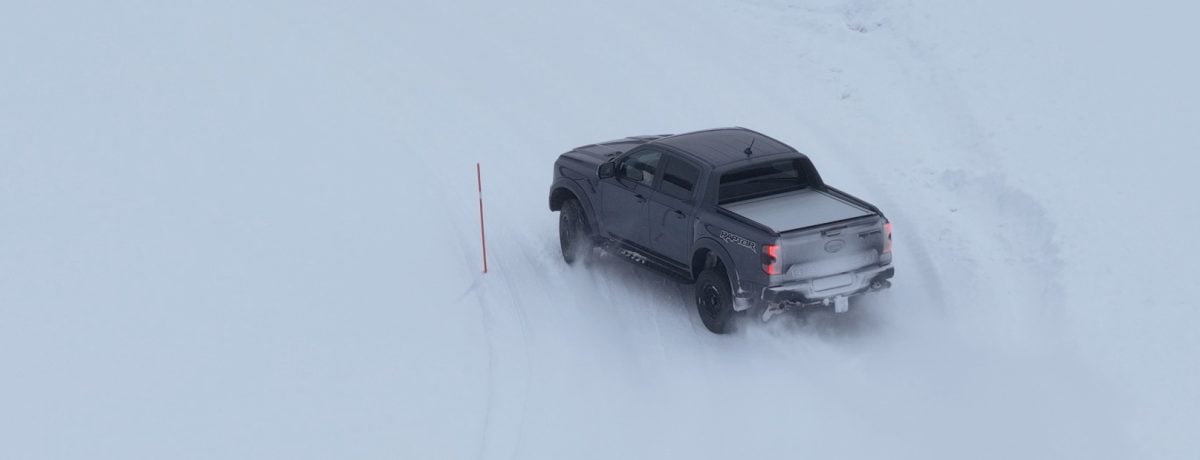
The Goodyear Wrangler DuraTrac RT was quickest in snow handling. There is no denying its grip. The Nokian was second, the all-season reference was third and the Pirelli Scorpion XTM AT was fourth, the first four were covered by just 0.86s.
Subjectively, the Pirelli Scorpion XTM AT was my favorite in the snow. It was rounded, predictable and easy to recover once sliding. The Nokian was almost the same, and this is exactly the sort of result I expected from Nokian - good balance, good control, no drama.
The Goodyear had plenty of grip, but it was a bit of a blunt instrument in how it delivered it, with a slightly peakier breakaway than the Pirelli and Nokian.
Snow Handling
Snow handling time in seconds [Average Temperature 28°F]
Lower is better ↓| Position / Tire | Result | Gap to best |
|---|---|---|
| 81.05 s | Best | |
| 81.61 s | +0.56 s | |
RefPirelli Scorpion AS Plus 3 |
81.64 s | +0.59 s |
| 81.91 s | +0.86 s | |
| 82.69 s | +1.64 s | |
| 83.41 s | +2.36 s | |
| 84.03 s | +2.98 s | |
| 88.92 s | +7.87 s |
The difference between best and worst was 9.7% (7.87 s).
Subj. Snow Handling
Subjective Snow Handling Score
Higher is better ↑| Position / Tire | Result | Gap to best |
|---|---|---|
| 8.7 Points | Best | |
| 8.6 Points | -0.10 Points | |
| 8.4 Points | -0.30 Points | |
| 8.3 Points | -0.40 Points | |
| 8.3 Points | -0.40 Points | |
RefPirelli Scorpion AS Plus 3 |
8.2 Points | -0.50 Points |
| 8 Points | -0.70 Points | |
| 7.7 Points | -1.00 Points |
The difference between best and worst was 11.5% (1 Points).
Snow braking
Snow braking was led by the Goodyear, and this is where its snow focus really paid off. The Pirelli Scorpion XTM AT was second, the Nokian third so the main winter-capable all-terrain group was close.
The Nitto was was acceptable, then there was a bigger step to the Westlake at 48ft and the all-season reference at 48ft. The Falken was last at 53ft, 10ft behind the best tire. That is a big gap on snow, and it matches the weak snow traction and handling result.
Snow Braking
Snow braking in feet (19 - 6 mph) [Average Temperature 23°F]
Lower is better ↓| Position / Tire | Result | Gap to best | Residual speed |
|---|---|---|---|
| 43 ft | Best | 0 mph | |
| 44 ft | +1 ft | 13 mph | |
| 44 ft | +1 ft | 14 mph | |
| 45 ft | +2 ft | 16 mph | |
| 45 ft | +2 ft | 19 mph | |
| 48 ft | +5 ft | 25 mph | |
RefPirelli Scorpion AS Plus 3 |
48 ft | +5 ft | 27 mph |
| 53 ft | +10 ft | 35 mph |
The difference between best and worst was 23.9% (10 ft ≈ 0.7 Car Lengths). From 80 mph, the Falken Wildpeak AT4W would still be travelling at 35 mph when the Goodyear Wrangler DuraTrac RT had stopped.
Residual speed is calculated from the measured braking distances, assuming constant deceleration; it is not a separate measurement.
Snow traction
Snow traction changed the order again. The Pirelli Scorpion XTM AT was best at with the all-season reference second and the Goodyear third.
The Falken was nearly 30 percent down on the best, the AT4W is not good enough in the snow if you live somewhere with proper winter conditions.
Snow Traction
Snow acceleration time (3 - 22 mph) [Average Temperature 23°F]
Lower is better ↓| Position / Tire | Result | Gap to best |
|---|---|---|
| 5.26 s | Best | |
RefPirelli Scorpion AS Plus 3 |
5.37 s | +0.11 s |
| 5.41 s | +0.15 s | |
| 5.44 s | +0.18 s | |
| 5.5 s | +0.24 s | |
| 6.23 s | +0.97 s | |
| 6.83 s | +1.57 s | |
| 7.25 s | +1.99 s |
The difference between best and worst was 37.8% (1.99 s).
Ice braking and traction
I also ran ice braking and traction. Twice: once at night at 27°F and once the next morning at 1°F. It did not go well.
My first mistake was brushing the ice in the middle of the first session, because I ran out of room. Then, at the end of the second session, the truck started having problems and it began to snow. The two sessions don't combine into one clean set of numbers, so instead of the usual chart, this one shows each tire's ice braking result as a range across both sessions.
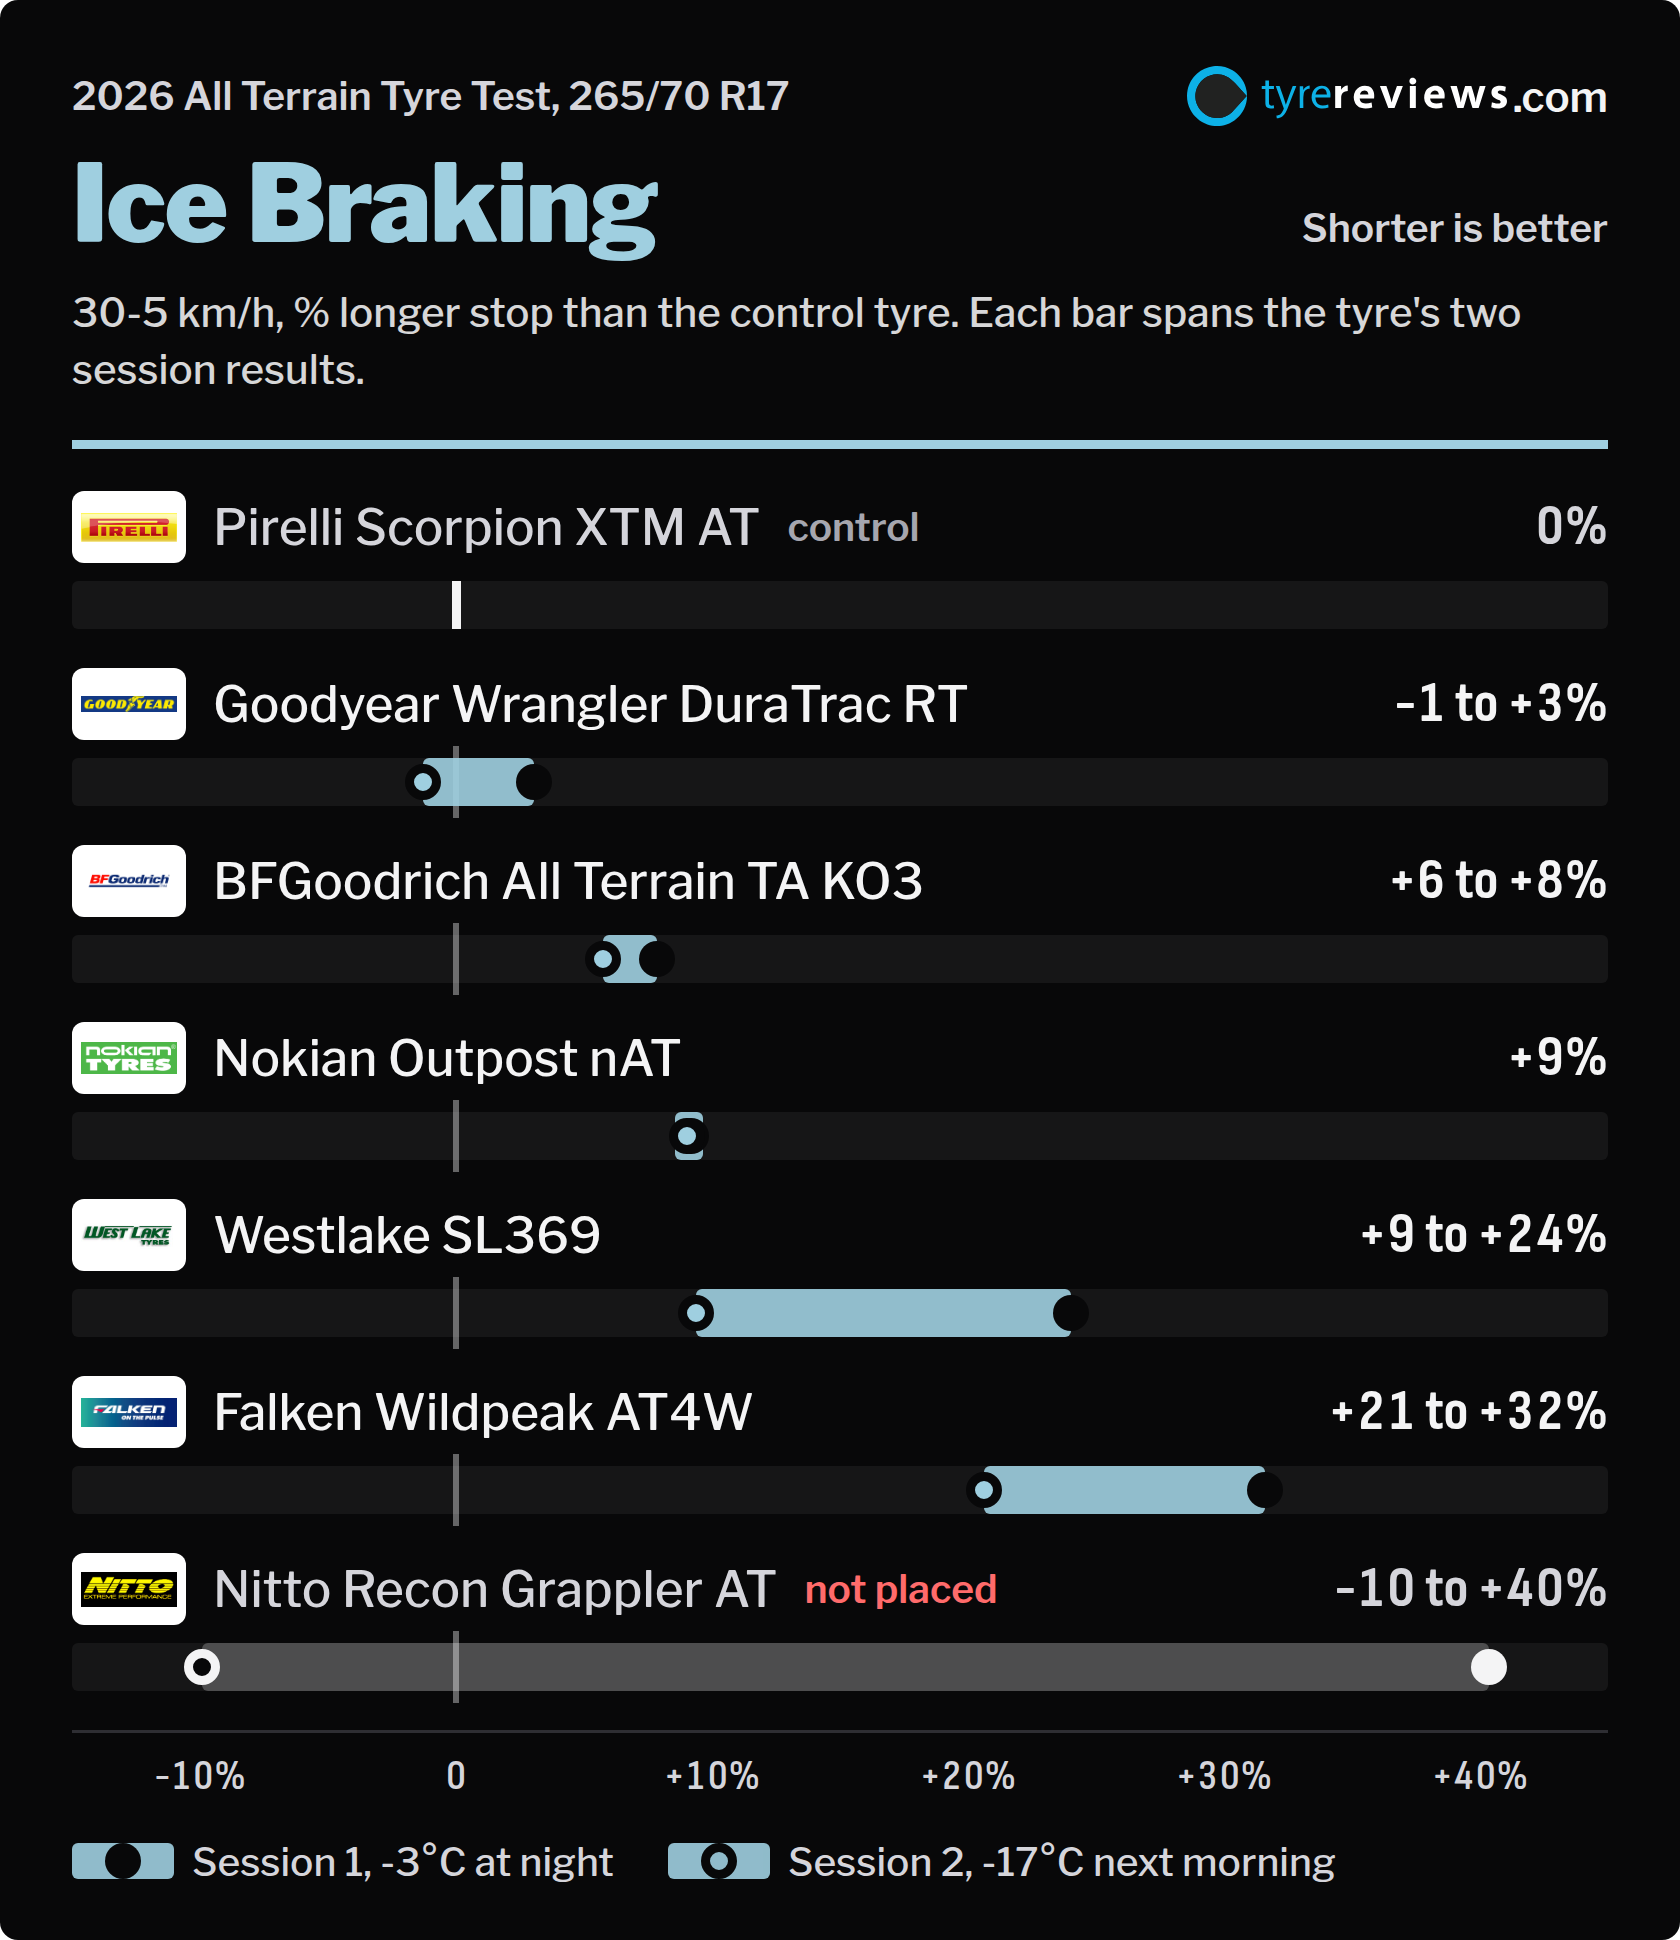
What held up in both sessions: the Pirelli Scorpion XTM AT and Goodyear Wrangler DuraTrac RT stopped shortest, the BFGoodrich KO3 and Nokian Outpost nAT were 5-10% behind them, the Westlake SL369 was further back again, and the Falken Wildpeak AT4W was clearly the longest-stopping of the group. The Nitto Recon Grappler AT was the unlucky tire that took the brunt of the problems in both sessions. It measured worst in the first session and best in the second, so I can't place it. Maybe it's good, maybe it's terrible. I don't know. Ice sucks.
Value, wear and what I did not test
Value
The value chart uses purchase price against warranted mileage, so lower is better. It is an imperfect metric because it assumes all tires make their warranties and it tells you nothing about grip, but it is still useful. Including the reference tire, the Pirelli Scorpion AS Plus 3 was best at $3.41 Price/1000. Among the all-terrains, the Westlake was cheapest at $4 Price/1000, which is no surprise.
The Nokian looks like the best value all-terrain when you include its performance, at $4.87 Price/1000 and at the other end of the spectrum the Goodyear was last at $6.24 Price/1000. The Goodyear is good in snow, but it is not cheap on this metric.
Value
Dollars/1000 miles based on mileage warranty
Lower is better ↓| Position / Tire | Result | Gap to best | cost per 1,000 miles |
|---|---|---|---|
RefPirelli Scorpion AS Plus 3 |
3.41 Price/1000 | -0.59 Price/1000 | $14.77 |
| 4 Price/1000 | Best | $23.07 | |
| 4.87 Price/1000 | +0.87 Price/1000 | — | |
| 4.95 Price/1000 | +0.95 Price/1000 | $25.91 | |
| 5.33 Price/1000 | +1.33 Price/1000 | $22.76 | |
| 5.39 Price/1000 | +1.39 Price/1000 | $26.30 | |
| 5.8 Price/1000 | +1.80 Price/1000 | $28.08 | |
| 6.24 Price/1000 | +2.24 Price/1000 | $31.63 |
The difference between best and worst was 83% (2.83 Price/1000). Over 25,000 miles the cheapest tire to own (Pirelli Scorpion AS Plus 3) works out $422 cheaper than the most expensive (Goodyear Wrangler DuraTrac RT).
How this is calculated
Tire life here is the manufacturer's treadwear warranty, NOT measured wear - treat it as the maker's promise, not a test result.
Tire life is the manufacturer's treadwear warranty, not measured wear. Assumes a typical car doing 29 mpg (rolling resistance causing 20% of fuel use), fuel at $3.60 per gallon and $80 fitting per set of four. US prices are from the time of the 2026 test; financing costs are excluded.
I have not included wear in the overall score because I do not currently have a good scientific way of deciding which of these tires will wear the best in the real world. After testing, all of them looked good. The Falken and Goodyear looked freshest by a small margin, the Nitto looked rougher because it was used as the off-road control and did more laps, and the Westlake was showing use, which also fits with it having the lowest warranted mileage. You can see closeups in the full video, linked above.
Rolling Resistance
Rolling resistance in kg t
Lower is better ↓| Position / Tire | Result | Gap to best | Extra fuel / year |
|---|---|---|---|
RefPirelli Scorpion AS Plus 3 |
8.2 kg/t | 0.00 kg/t | $0 |
| 8.2 kg/t | Best | $0 | |
| 9.3 kg/t | +1.10 kg/t | $39 | |
| 9.3 kg/t | +1.10 kg/t | $39 | |
| 9.8 kg/t | +1.60 kg/t | $57 | |
| 9.9 kg/t | +1.70 kg/t | $61 | |
| 9.9 kg/t | +1.70 kg/t | $61 |
The difference between best and worst was 20.7% (1.7 kg / t). Over 12,000 miles a year at $3.60/gal, the Westlake SL369 uses about 17 gal ($61) more fuel than the Nitto Recon Grappler AT.
Adjust the assumptions
Calculated estimates, not additional measurements. Use the controls to explore the assumptions.
I know people will ask about rock crawling, mud and towing. Rock crawling, at least in terms of raw grip, is closer to asphalt grip than most people think, so the dry braking numbers give a rough indication of that. Testing sidewall grip and damage resistance properly is much harder, and I am working on a solution. Mud is the impossible one within a close category. You can run the same tire ten times and get ten different objective results, even in a good mud pit. The only safe assumption is that all of these all-terrain tires would be much better than the all-season reference in mud. Much better.
Finally, all of these tires balanced up fine. I had no issues with any of them.
Verdict
The Pirelli Scorpion AS Plus 3 reference tire did exactly what I wanted it to do. It showed how good a road-biased tire can be for wet braking, wet handling, dry braking, comfort, measured noise and even some snow and dirt conditions. But it is not a replacement for a proper all-terrain. It does not have the same impact resistance, puncture resistance, mud ability or subjective off-road purchase as the best all-terrain tires.
So, my short answer: buy the Pirelli Scorpion XTM AT if you want the best all-terrain in this test, buy the Nokian Outpost nAT if you want the best blend of refinement, snow ability and value, consider the BFGoodrich if you want the traditional tough-feeling option, and only look at the Westlake if your use is mostly road-biased and budget matters more than refinement and snow.
Pirelli Scorpion XTM AT
265/70 R17 123/120S
Category scores (% of best)
All discipline results (17)
Discipline positions compare the ranked tires in this test, not the whole market. These are individual measurements, not weighted overall scores.
| Test | Position in discipline | Result | Gap to best |
|---|---|---|---|
| Dry BrakingLower is better | 1st / 7 | 134 ft | Best in this discipline |
| Subj. Dry HandlingHigher is better | 2nd / 7 | 9.75 Points | -0.25 Points |
| Wet BrakingLower is better | 1st / 7 | 117 ft | Best in this discipline |
| Wet HandlingLower is better | 1st / 7 | 119.98 s | Best in this discipline |
| Subj. Wet HandlingHigher is better | 1st / 7 | 8.9 Points | Best in this discipline |
| Straight AquaHigher is better | 4th / 7 | 63.1 mph | -2.6 mph |
| Snow BrakingLower is better | 2nd / 7 | 44 ft | +1 ft |
| Snow TractionLower is better | 1st / 7 | 5.26 s | Best in this discipline |
| Snow HandlingLower is better | 3rd / 7 | 81.91 s | +0.86 s |
| Subj. Snow HandlingHigher is better | 1st / 7 | 8.7 Points | Best in this discipline |
| Dirt HandlingLower is better | 1st / 7 | 74.05 s | Best in this discipline |
| Subj. Dirt HandlingHigher is better | 1st / 7 | 8.6 Points | Best in this discipline |
| Subj. ComfortHigher is better | 3rd / 7 | 9.5 Points | -0.50 Points |
| Subj. NoiseHigher is better | 3rd / 7 | 9 Points | -1.00 Points |
| NoiseLower is better | 3rd / 7 | 54.95 dB | +0.33 dB |
| ValueLower is better | 5th / 7 | 5.39 Price/1000 | +1.39 Price/1000 |
| Rolling ResistanceLower is better | 2nd / 6 | 9.3 kg/t | +1.10 kg/t |
- Production
- 4525
- Origin
- Brazil
- 3PMSF
- Yes
- Weight
- 23.13 kgs
- Tread
- 11.1 mm
- Price
- 296.56
Nokian Outpost nAT
265/70 R17 123/120S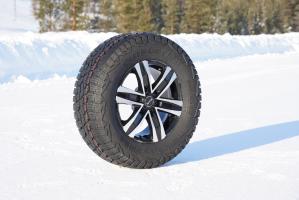
Category scores (% of best)
All discipline results (16)
Discipline positions compare the ranked tires in this test, not the whole market. These are individual measurements, not weighted overall scores.
| Test | Position in discipline | Result | Gap to best |
|---|---|---|---|
| Dry BrakingLower is better | 5th / 7 | 149 ft | +15 ft |
| Subj. Dry HandlingHigher is better | 1st / 7 | 10 Points | Best in this discipline |
| Wet BrakingLower is better | 5th / 7 | 139 ft | +22 ft |
| Wet HandlingLower is better | 3rd / 7 | 129.07 s | +9.09 s |
| Subj. Wet HandlingHigher is better | 3rd / 7 | 8.2 Points | -0.70 Points |
| Straight AquaHigher is better | 1st / 7 | 65.7 mph | Best in this discipline |
| Snow BrakingLower is better | 3rd / 7 | 44 ft | +1 ft |
| Snow TractionLower is better | 4th / 7 | 5.5 s | +0.24 s |
| Snow HandlingLower is better | 2nd / 7 | 81.61 s | +0.56 s |
| Subj. Snow HandlingHigher is better | 2nd / 7 | 8.6 Points | -0.10 Points |
| Dirt HandlingLower is better | 6th / 7 | 75.43 s | +1.38 s |
| Subj. Dirt HandlingHigher is better | 2nd / 7 | 8.5 Points | -0.10 Points |
| Subj. ComfortHigher is better | 1st / 7 | 10 Points | Best in this discipline |
| Subj. NoiseHigher is better | 1st / 7 | 10 Points | Best in this discipline |
| NoiseLower is better | 2nd / 7 | 54.83 dB | +0.21 dB |
| ValueLower is better | 2nd / 7 | 4.87 Price/1000 | +0.87 Price/1000 |
- Production
- 4725
- 3PMSF
- Yes
- Weight
- 23.13 kgs
- Tread
- 14.3 mm
- Price
- 292.00
BFGoodrich All Terrain TA KO3
265/70 R17 123/120S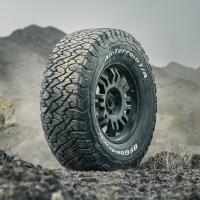
Category scores (% of best)
All discipline results (17)
Discipline positions compare the ranked tires in this test, not the whole market. These are individual measurements, not weighted overall scores.
| Test | Position in discipline | Result | Gap to best |
|---|---|---|---|
| Dry BrakingLower is better | 7th / 7 | 154 ft | +20 ft |
| Subj. Dry HandlingHigher is better | 4th / 7 | 9 Points | -1.00 Points |
| Wet BrakingLower is better | 3rd / 7 | 132 ft | +15 ft |
| Wet HandlingLower is better | 4th / 7 | 129.16 s | +9.18 s |
| Subj. Wet HandlingHigher is better | 4th / 7 | 8 Points | -0.90 Points |
| Straight AquaHigher is better | 3rd / 7 | 63.4 mph | -2.3 mph |
| Snow BrakingLower is better | 4th / 7 | 45 ft | +2 ft |
| Snow TractionLower is better | 3rd / 7 | 5.44 s | +0.18 s |
| Snow HandlingLower is better | 4th / 7 | 82.69 s | +1.64 s |
| Subj. Snow HandlingHigher is better | 4th / 7 | 8.3 Points | -0.40 Points |
| Dirt HandlingLower is better | 3rd / 7 | 74.87 s | +0.82 s |
| Subj. Dirt HandlingHigher is better | 3rd / 7 | 8.4 Points | -0.20 Points |
| Subj. ComfortHigher is better | 1st / 7 | 10 Points | Best in this discipline |
| Subj. NoiseHigher is better | 2nd / 7 | 9.5 Points | -0.50 Points |
| NoiseLower is better | 7th / 7 | 57.72 dB | +3.10 dB |
| ValueLower is better | 6th / 7 | 5.8 Price/1000 | +1.80 Price/1000 |
| Rolling ResistanceLower is better | 2nd / 6 | 9.3 kg/t | +1.10 kg/t |
- Production
- 4625
- Origin
- USA
- 3PMSF
- Yes
- Weight
- 24.95 kgs
- Tread
- 12.7 mm
- Price
- 289.99
Westlake SL369
265/70 R17 123/120Q
Category scores (% of best)
All discipline results (17)
Discipline positions compare the ranked tires in this test, not the whole market. These are individual measurements, not weighted overall scores.
| Test | Position in discipline | Result | Gap to best |
|---|---|---|---|
| Dry BrakingLower is better | 3rd / 7 | 148 ft | +14 ft |
| Subj. Dry HandlingHigher is better | 4th / 7 | 9 Points | -1.00 Points |
| Wet BrakingLower is better | 2nd / 7 | 122 ft | +5 ft |
| Wet HandlingLower is better | 2nd / 7 | 124.12 s | +4.14 s |
| Subj. Wet HandlingHigher is better | 2nd / 7 | 8.3 Points | -0.60 Points |
| Straight AquaHigher is better | 2nd / 7 | 63.5 mph | -2.2 mph |
| Snow BrakingLower is better | 6th / 7 | 48 ft | +5 ft |
| Snow TractionLower is better | 6th / 7 | 6.83 s | +1.57 s |
| Snow HandlingLower is better | 5th / 7 | 83.41 s | +2.36 s |
| Subj. Snow HandlingHigher is better | 6th / 7 | 8 Points | -0.70 Points |
| Dirt HandlingLower is better | 5th / 7 | 75.35 s | +1.30 s |
| Subj. Dirt HandlingHigher is better | 7th / 7 | 7.9 Points | -0.70 Points |
| Subj. ComfortHigher is better | 7th / 7 | 7 Points | -3.00 Points |
| Subj. NoiseHigher is better | 7th / 7 | 6 Points | -4.00 Points |
| NoiseLower is better | 1st / 7 | 54.62 dB | Best in this discipline |
| ValueLower is better | 1st / 7 | 4 Price/1000 | Best in this discipline |
| Rolling ResistanceLower is better | 5th / 6 | 9.9 kg/t | +1.70 kg/t |
- 3PMSF
- Yes
- Weight
- 24.2 kgs
- Tread
- 12.7 mm
- Price
- 160.00
Goodyear Wrangler DuraTrac RT
265/70 R17 123/120S
Category scores (% of best)
All discipline results (17)
Discipline positions compare the ranked tires in this test, not the whole market. These are individual measurements, not weighted overall scores.
| Test | Position in discipline | Result | Gap to best |
|---|---|---|---|
| Dry BrakingLower is better | 6th / 7 | 152 ft | +18 ft |
| Subj. Dry HandlingHigher is better | 4th / 7 | 9 Points | -1.00 Points |
| Wet BrakingLower is better | 4th / 7 | 136 ft | +19 ft |
| Wet HandlingLower is better | 5th / 7 | 129.7 s | +9.72 s |
| Subj. Wet HandlingHigher is better | 5th / 7 | 7.8 Points | -1.10 Points |
| Straight AquaHigher is better | 5th / 7 | 63.0 mph | -2.7 mph |
| Snow BrakingLower is better | 1st / 7 | 43 ft | Best in this discipline |
| Snow TractionLower is better | 2nd / 7 | 5.41 s | +0.15 s |
| Snow HandlingLower is better | 1st / 7 | 81.05 s | Best in this discipline |
| Subj. Snow HandlingHigher is better | 3rd / 7 | 8.4 Points | -0.30 Points |
| Dirt HandlingLower is better | 2nd / 7 | 74.68 s | +0.63 s |
| Subj. Dirt HandlingHigher is better | 4th / 7 | 8.3 Points | -0.30 Points |
| Subj. ComfortHigher is better | 5th / 7 | 8.75 Points | -1.25 Points |
| Subj. NoiseHigher is better | 4th / 7 | 8.5 Points | -1.50 Points |
| NoiseLower is better | 6th / 7 | 56.01 dB | +1.39 dB |
| ValueLower is better | 7th / 7 | 6.24 Price/1000 | +2.24 Price/1000 |
| Rolling ResistanceLower is better | 5th / 6 | 9.9 kg/t | +1.70 kg/t |
- Production
- 4425
- Origin
- USA
- 3PMSF
- Yes
- Weight
- 24.49 kgs
- Tread
- 14.3 mm
- Price
- 311.99
Falken Wildpeak AT4W
265/70 R17 123/120S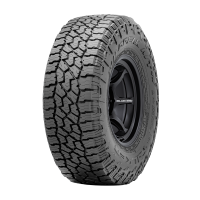
Category scores (% of best)
All discipline results (17)
Discipline positions compare the ranked tires in this test, not the whole market. These are individual measurements, not weighted overall scores.
| Test | Position in discipline | Result | Gap to best |
|---|---|---|---|
| Dry BrakingLower is better | 2nd / 7 | 145 ft | +11 ft |
| Subj. Dry HandlingHigher is better | 3rd / 7 | 9.5 Points | -0.50 Points |
| Wet BrakingLower is better | 6th / 7 | 139 ft | +22 ft |
| Wet HandlingLower is better | 6th / 7 | 131.17 s | +11.19 s |
| Subj. Wet HandlingHigher is better | 6th / 7 | 7.5 Points | -1.40 Points |
| Straight AquaHigher is better | 7th / 7 | 59.3 mph | -6.4 mph |
| Snow BrakingLower is better | 7th / 7 | 53 ft | +10 ft |
| Snow TractionLower is better | 7th / 7 | 7.25 s | +1.99 s |
| Snow HandlingLower is better | 7th / 7 | 88.92 s | +7.87 s |
| Subj. Snow HandlingHigher is better | 7th / 7 | 7.7 Points | -1.00 Points |
| Dirt HandlingLower is better | 4th / 7 | 75.18 s | +1.13 s |
| Subj. Dirt HandlingHigher is better | 4th / 7 | 8.3 Points | -0.30 Points |
| Subj. ComfortHigher is better | 4th / 7 | 9 Points | -1.00 Points |
| Subj. NoiseHigher is better | 4th / 7 | 8.5 Points | -1.50 Points |
| NoiseLower is better | 4th / 7 | 55.05 dB | +0.43 dB |
| ValueLower is better | 3rd / 7 | 4.95 Price/1000 | +0.95 Price/1000 |
| Rolling ResistanceLower is better | 4th / 6 | 9.8 kg/t | +1.60 kg/t |
- Production
- 3325
- Origin
- Thailand
- 3PMSF
- Yes
- Weight
- 24.04 kgs
- Tread
- 13.5 mm
- Price
- 297.00
Nitto Recon Grappler AT
265/70 R17 123/120S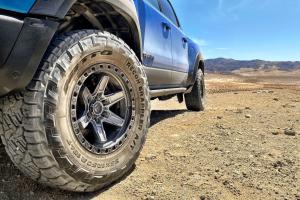
Category scores (% of best)
All discipline results (17)
Discipline positions compare the ranked tires in this test, not the whole market. These are individual measurements, not weighted overall scores.
| Test | Position in discipline | Result | Gap to best |
|---|---|---|---|
| Dry BrakingLower is better | 4th / 7 | 148 ft | +14 ft |
| Subj. Dry HandlingHigher is better | 4th / 7 | 9 Points | -1.00 Points |
| Wet BrakingLower is better | 7th / 7 | 149 ft | +32 ft |
| Wet HandlingLower is better | 7th / 7 | 133.82 s | +13.84 s |
| Subj. Wet HandlingHigher is better | 7th / 7 | 6.6 Points | -2.30 Points |
| Straight AquaHigher is better | 6th / 7 | 60.3 mph | -5.4 mph |
| Snow BrakingLower is better | 5th / 7 | 45 ft | +2 ft |
| Snow TractionLower is better | 5th / 7 | 6.23 s | +0.97 s |
| Snow HandlingLower is better | 6th / 7 | 84.03 s | +2.98 s |
| Subj. Snow HandlingHigher is better | 4th / 7 | 8.3 Points | -0.40 Points |
| Dirt HandlingLower is better | 7th / 7 | 75.59 s | +1.54 s |
| Subj. Dirt HandlingHigher is better | 6th / 7 | 8.1 Points | -0.50 Points |
| Subj. ComfortHigher is better | 6th / 7 | 8 Points | -2.00 Points |
| Subj. NoiseHigher is better | 6th / 7 | 7 Points | -3.00 Points |
| NoiseLower is better | 5th / 7 | 55.75 dB | +1.13 dB |
| ValueLower is better | 4th / 7 | 5.33 Price/1000 | +1.33 Price/1000 |
| Rolling ResistanceLower is better | 1st / 6 | 8.2 kg/t | Best in this discipline |
- Origin
- USA
- 3PMSF
- Yes
- Weight
- 22.68 kgs
- Tread
- 12.5 mm
- Price
- 293.00
Pirelli Scorpion AS+ 3
265/70 R17 115H
All discipline results (17)
Discipline positions compare the ranked tires in this test, not the whole market. These are individual measurements, not weighted overall scores.
| Test | Result |
|---|---|
| Dry BrakingLower is better | 132 ft |
| Subj. Dry HandlingHigher is better | 11 Points |
| Wet BrakingLower is better | 110 ft |
| Wet HandlingLower is better | 117.67 s |
| Subj. Wet HandlingHigher is better | 8.4 Points |
| Straight AquaHigher is better | 63.5 mph |
| Snow BrakingLower is better | 48 ft |
| Snow TractionLower is better | 5.37 s |
| Snow HandlingLower is better | 81.64 s |
| Subj. Snow HandlingHigher is better | 8.2 Points |
| Dirt HandlingLower is better | 74.56 s |
| Subj. Dirt HandlingHigher is better | 8.3 Points |
| Subj. ComfortHigher is better | 11 Points |
| Subj. NoiseHigher is better | 10 Points |
| NoiseLower is better | 52.79 dB |
| ValueLower is better | 3.41 Price/1000 |
| Rolling ResistanceLower is better | 8.2 kg/t |
- Production
- 4525
- Origin
- Brazil
- UTQG
- 800 A A
- Weight
- 18.14 kgs
- Tread
- 8.7 mm
- Price
- 238.42

Sometimes E and C are exactly the same tire as it's easier for manufacturing, however if the C and E are different then it can alter overall results, though generally the good tires remain good.
Thanks