



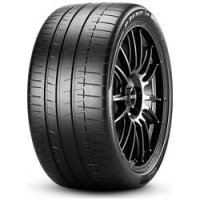
These four tires might be the fastest track-focused, street-legal tires you can buy in both Europe and North America right now. The Pirelli P Zero Trofeo RS, the Michelin Pilot Sport Cup 2 R, the Bridgestone Potenza Race, and the Vitour Tempesta P1 Plus - all tested on a VW Golf GTI Clubsport in 235/35 R19.
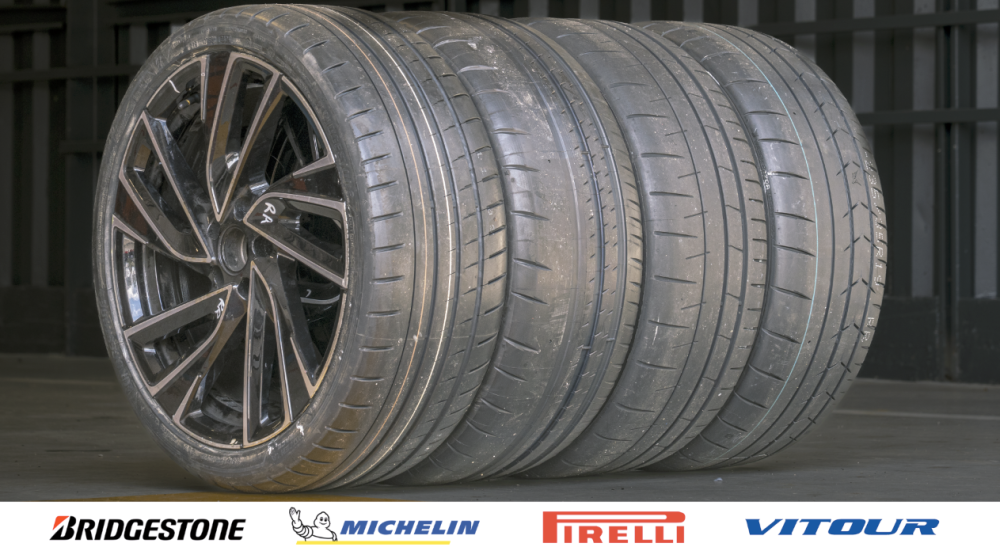
And it's not just a dry track test. I've tested wet handling, wet braking, aquaplaning, and rolling resistance too, because while yes, these tires are built to go fast in the dry, some of you will be driving them on the road. Some of you will get caught in the rain on a track day. And I think that data matters.
Test setup & methodology
The test setting, the conditions recorded and how the results contribute to the score.
- Tire Pressures (as recorded)
- 2.5
- Test Driver
- Jonathan Benson
Show full testing methodology
Recorded test conditions
- Dry Braking
- 62.1 → 6.2 mph
- Dry Handling
- 75–77 °F
- Wet Braking
- 49.7 → 6.2 mph
- Wet Handling
- 64–66 °F
Score Weighting
Weights express the scoring priorities, not how much each discipline actually changed the finishing order. The size of the performance gaps matters too. Category weights contribute to the overall score. Within each category, discipline weights divide that category’s share. Published finishing positions also need to be read alongside the editorial verdict.
| Test | Within category | Share of overall score |
|---|---|---|
| Dry · 85% | ||
| Dry Braking | 20% | 17% |
| Dry Handling | 40% | 34% |
| Subj. Dry Handling | 40% | 34% |
| Wet · 10% | ||
| Wet Braking | 30% | 3% |
| Wet Handling | 30% | 3% |
| Subj. Wet Handling | 30% | 3% |
| Straight Aqua | 10% | 1% |
| Value · 5% | ||
| Rolling Resistance | 100% | 5% |
Our standard methods
The conditions above are recorded for this test. The descriptions below explain our standard procedures; measurement windows and run counts can vary by test.
Dry Braking
For dry braking, I drive the test vehicle at an entry speed of 110 km/h and apply full braking effort to a standstill with ABS active on clean, dry asphalt. I typically use an 100–5 km/h measurement window. My standard programme is five runs per tire set where possible, although the sequence can extend to as many as fifteen runs if conditions and tire category justify it. I analyze the full set of runs and discard statistical outliers before averaging. Reference tires are run repeatedly throughout the session to correct for changing conditions.
Dry Handling
For dry handling, I drive at the limit of adhesion around a dedicated handling circuit with ESC disabled where possible so I can assess the tire's natural balance, transient response, and limit behavior without electronic intervention masking the result. I usually complete between two and five timed laps per tire set, depending on the circuit, tire type, and consistency of conditions. I exclude laps affected by clear driver error or obvious environmental inconsistency. Control runs are carried out frequently throughout the session, and I often use multiple sets of control tires so that wear on the references does not become a meaningful variable. For more track-focused products, I also do endurance testing, which is a set number of laps at race pace to determine tire wear patterns and heat resistance over longer driving.
Subj. Dry Handling
I also carry out a structured subjective handling assessment at the limit of adhesion on a dedicated dry handling circuit. I score steering precision, steering response, turn-in behavior, mid-corner balance, corner-exit traction, breakaway characteristics, and overall confidence using a standardised 1–10 scale used consistently across my testing. The final assessment combines numeric scoring with written technical commentary. I complete familiarisation laps on the control tire before evaluating each candidate.
Wet Braking
For wet braking, I drive the test vehicle at an entry speed of 88 km/h and apply full braking effort to a standstill with ABS active on an asphalt surface with a controlled water film. I typically use an 80–5 km/h measurement window to isolate tire performance from variability in the initial brake application. My standard programme is eight runs per tire set where possible, although the sequence can extend to as many as fifteen runs if conditions and tire category justify it. I analyze the full set of runs and discard statistical outliers before averaging. To correct for changing conditions, I run reference tires repeatedly throughout the session — in wet testing, typically every three candidate test sets.
Wet Handling
For wet handling, I drive at the limit of adhesion around a dedicated handling circuit. I generally use specialist wet circuits with kerb-watering systems designed to maintain a consistent surface condition. ESC is disabled where possible so I can assess the tire's natural balance, transient response, and limit behavior without electronic intervention masking the result. I usually complete between two and five timed laps per tire set, depending on the circuit, tire type, and consistency of conditions. I exclude laps affected by clear driver error or obvious environmental inconsistency. Control runs are carried out frequently throughout the session, and I often use multiple sets of control tires so that wear on the references does not become a meaningful variable.
Subj. Wet Handling
I also carry out a structured subjective handling assessment at the limit of adhesion on a dedicated wet handling circuit. I score steering precision, steering response, turn-in behavior, mid-corner balance, aquaplaning resistance, breakaway characteristics, and overall confidence using a standardised 1–10 scale used consistently across my testing. The final assessment combines numeric scoring with written technical commentary. I complete familiarisation laps on the control tire before evaluating each candidate.
Straight Aqua
To measure straight-line aquaplaning resistance, I drive one side of the vehicle through a water trough of controlled depth, typically around 7 mm, while the opposite side remains on dry pavement. I enter at a fixed speed and then accelerate progressively. I define aquaplaning onset as the point at which the wheel travelling through the water exceeds a specified slip threshold relative to the dry-side reference wheel. I usually perform four runs per tire set and average the valid results.
Rolling Resistance
Rolling resistance is measured under controlled laboratory conditions in accordance with ISO 28580 and UNECE Regulation 117 Annex 6. The tire is mounted on a test wheel and loaded against a large-diameter steel drum. After thermal stabilisation at the prescribed test speed, rolling resistance force is measured at the spindle and corrected according to the relevant procedure. The result is expressed as rolling resistance coefficient, typically in kg/tonne.
Dry
This is what these tires are all about. The dry is where they're supposed to shine, and there were some genuine surprises in the data - both in how close some tires were and how far apart others ended up.
Dry Braking
The Pirelli Trofeo RS was shortest here at 106ft, with the Vitour close behind at 108ft. The Michelin was mid-pack at 110ft. The real surprise is the Bridgestone Potenza Race at 117ft - nearly 10% off the Pirelli, which is a bigger gap than I expected for a tire in this category.
Dry Braking
Dry braking in feet (62 - 6 mph)
Lower is better ↓| Position / Tire | Result | Gap to best | Residual speed |
|---|---|---|---|
| 106 ft | Best | 0 mph | |
| 108 ft | +2 ft | 11 mph | |
| 110 ft | +4 ft | 15 mph | |
| 117 ft | +11 ft | 25 mph |
The difference between best and worst was 10.7% (11 ft ≈ 0.8 Car Lengths). From 80 mph, the Bridgestone Potenza Race would still be travelling at 25 mph when the Pirelli P Zero Trofeo RS had stopped.
Residual speed is calculated from the measured braking distances, assuming constant deceleration; it is not a separate measurement.
Dry Handling
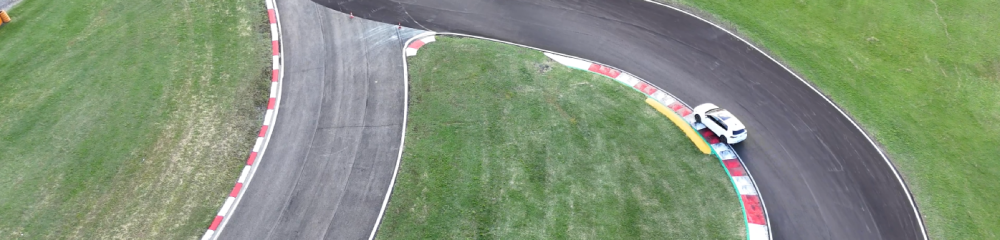
The Pirelli was the clear standout, posting a 79.53s average - over 1.3 seconds faster than everything else. I had to recalibrate my braking points twice because the grip kept being more than I expected. There's a fast left-right chicane where every other tire had me hesitating on turn-in, waiting for it to load up and grip - with the Trofeo RS I could flick it left, flick it right, stomp on the power and the tire just gave me everything. It was the first tire where I didn't feel like I was constantly managing understeer into corners. Behind it, the Vitour beat the Bridgestone and the Michelin. The Vitour's steering was crisp and it dug in well on turn-in, though I noticed more thermal degradation towards the end of its runs - its first lap was very quick but it dropped off significantly by the fourth, both in time and subjectively. The Michelin felt more connected to the road than its lap time suggests; the steering built up nicely, it was sharper mid-corner, and you could get on the power earlier than the Bridgestone. But it just didn't translate into faster times. The Bridgestone had a fun nonlinear steering ramp-up at sub-limit, but once you really pushed, it became the only tire where I had trouble trail braking into corners - the construction felt a bit muddied at the very limit.
Dry Handling
Dry handling time in seconds [Average Temperature 76°F]
Lower is better ↓| Position / Tire | Result | Gap to best |
|---|---|---|
| 79.53 s | Best | |
| 80.84 s | +1.31 s | |
| 81.37 s | +1.84 s | |
| 81.51 s | +1.98 s |
All the tires in the Dry Handling test finished less than 3% apart.
Wet
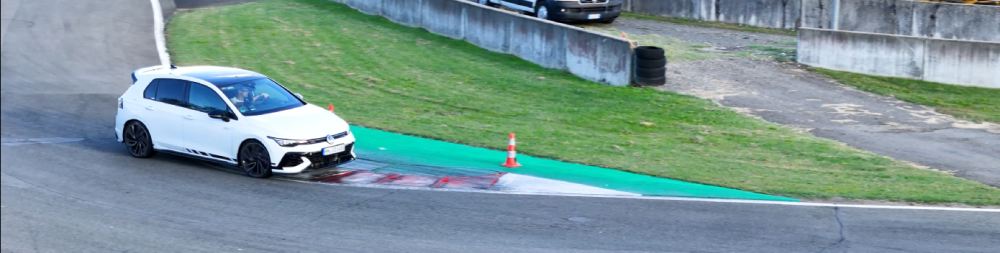
Wet is not the design focus of these tires, and I haven't weighted it heavily in the overall results. But I still think it's worth testing - this is data for the track day that gets rained on, or the driver running these as their daily on a fast car. Testing was done at around 18.5°C with a full warm-up lap to give the compounds a fair chance to build temperature.

Wet Braking
The Bridgestone Potenza Race was in a different league here - 92ft, a full 16 feet shorter than the next best (Michelin at 108ft). That's roughly 15% better, which is almost hard to believe. The Pirelli came in at 114ft and the Vitour was weakest at 119ft. If you're driving these on the road in the wet, the Bridgestone's stopping advantage is enormous.
Wet Braking
Wet braking in feet (50 - 6 mph)
Lower is better ↓| Position / Tire | Result | Gap to best | Residual speed |
|---|---|---|---|
| 92 ft | Best | 0 mph | |
| 108 ft | +16 ft | 31 mph | |
| 114 ft | +22 ft | 35 mph | |
| 119 ft | +27 ft | 38 mph |
The difference between best and worst was 29.6% (27 ft ≈ 1.8 Car Lengths). From 80 mph, the Vitour Tempesta P1+ would still be travelling at 38 mph when the Bridgestone Potenza Race had stopped.
Residual speed is calculated from the measured braking distances, assuming constant deceleration; it is not a separate measurement.
Wet Handling
The Bridgestone was in a complete class of its own - 103.87s, nearly six seconds clear of the Pirelli in second (109.72s). The grip felt endless and the balance was an easy, safe understeer; every lap was within three tenths of each other, which is remarkable on a complicated wet circuit. It wasn't the sportiest feeling tire on the front axle, with slightly dead steering around center and a hint of delay in the front-rear phase, but the sheer confidence it gave you more than made up for it. The Pirelli placed second and had strong raw grip when the rubber was on the ground, but aquaplaning at the rear kept catching it out, making it more entertaining than you'd want on a wet track day. The Vitour (111.54s) and Michelin (111.67s) were essentially tied at the back on time. The Michelin was lovely to drive - the way the rear followed the front was beautiful, and it had real grip once it was warm - but it showed more run-to-run variability. The Vitour had the slowest warm-up of the group; its fronts didn't come alive until the end of the out-lap and the rears took even longer, which meant its earlier laps were noticeably slower. Once warm it was up there with the Michelin, but that warm-up penalty really hurt the average.
Wet Handling
Wet handling time in seconds [Average Temperature 65°F]
Lower is better ↓| Position / Tire | Result | Gap to best |
|---|---|---|
| 103.87 s | Best | |
| 109.72 s | +5.85 s | |
| 111.54 s | +7.67 s | |
| 111.67 s | +7.80 s |
The difference between best and worst was 7.5% (7.8 s).
Straight Aquaplaning
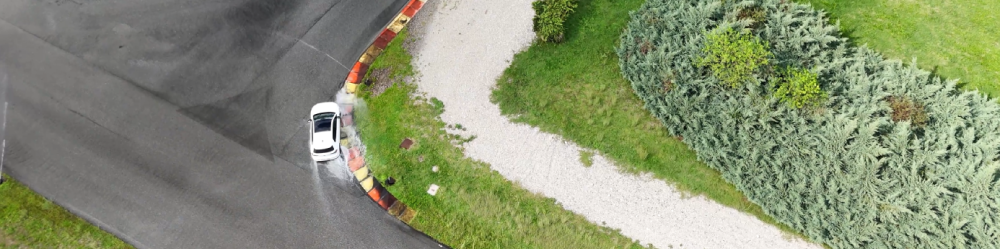
My hunch during the wet handling laps was right - both the Pirelli and Vitour struggled here compared to the Michelin. The Cup 2 R floated at 45.6 mph, just ahead of the Bridgestone at 73.1. The Pirelli was notably lower at 43.9 mph, and the Vitour weakest at 42.9 mph. That said, the differences were relatively small compared to the wet braking and handling gaps.
Straight Aqua
Float Speed in mph
Higher is better ↑| Position / Tire | Result | Gap to best |
|---|---|---|
| 45.6 mph | Best | |
| 45.4 mph | -0.2 mph | |
| 43.9 mph | -1.7 mph | |
| 42.9 mph | -2.7 mph |
The difference between best and worst was 5.9% (2.7 mph).

Value
Rolling Resistance
Nobody buys a track tire for its fuel efficiency, but here's the data anyway - and it might matter if rolling resistance is eating into your top speed on a long straight. The Bridgestone was the most efficient at 8.9 kg/t, with the Michelin second at 9.4. The Pirelli was 9.9 and the Vitour was worst at 10.9 - around 22% higher than the Bridgestone, which is a sizeable gap.
Rolling Resistance
Rolling resistance in kg t
Lower is better ↓| Position / Tire | Result | Gap to best | Extra fuel / year |
|---|---|---|---|
| 8.9 kg/t | Best | $0 | |
| 9.4 kg/t | +0.50 kg/t | $17 | |
| 9.9 kg/t | +1.00 kg/t | $33 | |
| 10.9 kg/t | +2.00 kg/t | $66 |
The difference between best and worst was 22.5% (2 kg / t). Over 12,000 miles a year at $3.60/gal, the Vitour Tempesta P1+ uses about 18 gal ($66) more fuel than the Bridgestone Potenza Race.
Adjust the assumptions
Calculated estimates, not additional measurements. Use the controls to explore the assumptions.
Results
With a heavy dry weighting - because that's what these tires are for - the Pirelli P Zero Trofeo RS won the test. Its WRC-derived compound and construction made it the fastest in dry braking, dry handling, and subjective feel, and it had the most stable thermal degradation of the group. The Michelin Cup 2 R finished second: not the fastest on stopwatch, but easy to drive, consistent, and with the best aquaplaning resistance. The Vitour Tempesta P1 Plus took third - a seriously strong result for a brand competing against premium giants, though watch the thermal degradation and wear on longer stints. The Bridgestone Potenza Race finished last on the dry-biased scoring, but don't let that fool you - in the wet it was untouchable, and if you want a very fast tire you can also use every day in the rain, nothing here comes close to it. None of these are bad tires; it just depends on what you need from them.

Pirelli P Zero Trofeo RS
235/35 R19 91Y XL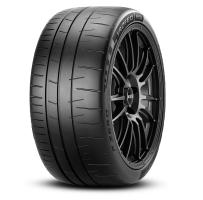
In the wet it sat in the lower half of the group for braking and aquaplaning speed, and it didn't have the same rear-axle confidence as the best wet tire. Rolling resistance was also on the higher side compared with the top performers, so it's a very dry-focused choice.
Category scores (% of best)
All discipline results (8)
Discipline positions compare the ranked tires in this test, not the whole market. These are individual measurements, not weighted overall scores.
| Test | Position in discipline | Result | Gap to best |
|---|---|---|---|
| Dry BrakingLower is better | 1st / 4 | 106 ft | Best in this discipline |
| Dry HandlingLower is better | 1st / 4 | 79.53 s | Best in this discipline |
| Subj. Dry HandlingHigher is better | 1st / 4 | 8.8 Points | Best in this discipline |
| Wet BrakingLower is better | 3rd / 4 | 114 ft | +22 ft |
| Wet HandlingLower is better | 2nd / 4 | 109.72 s | +5.85 s |
| Subj. Wet HandlingHigher is better | 2nd / 4 | 8.4 Points | -0.70 Points |
| Straight AquaHigher is better | 3rd / 4 | 43.9 mph | -1.7 mph |
| Rolling ResistanceLower is better | 3rd / 4 | 9.9 kg/t | +1.00 kg/t |
- UTQG
- 180 A A
- Tread
- 5.3 mm
Michelin Pilot Sport Cup 2 R
235/35 R19 91Y XL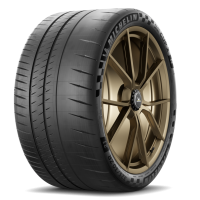
Category scores (% of best)
All discipline results (8)
Discipline positions compare the ranked tires in this test, not the whole market. These are individual measurements, not weighted overall scores.
| Test | Position in discipline | Result | Gap to best |
|---|---|---|---|
| Dry BrakingLower is better | 3rd / 4 | 110 ft | +4 ft |
| Dry HandlingLower is better | 4th / 4 | 81.51 s | +1.98 s |
| Subj. Dry HandlingHigher is better | 2nd / 4 | 8.5 Points | -0.30 Points |
| Wet BrakingLower is better | 2nd / 4 | 108 ft | +16 ft |
| Wet HandlingLower is better | 4th / 4 | 111.67 s | +7.80 s |
| Subj. Wet HandlingHigher is better | 3rd / 4 | 8.2 Points | -0.90 Points |
| Straight AquaHigher is better | 1st / 4 | 45.6 mph | Best in this discipline |
| Rolling ResistanceLower is better | 2nd / 4 | 9.4 kg/t | +0.50 kg/t |
- UTQG
- 140 A A
- Tread
- 4.5 mm
Vitour Tempesta P1+
235/35 R19 91Y XL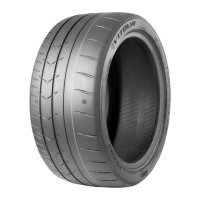
Category scores (% of best)
All discipline results (8)
Discipline positions compare the ranked tires in this test, not the whole market. These are individual measurements, not weighted overall scores.
| Test | Position in discipline | Result | Gap to best |
|---|---|---|---|
| Dry BrakingLower is better | 2nd / 4 | 108 ft | +2 ft |
| Dry HandlingLower is better | 2nd / 4 | 80.84 s | +1.31 s |
| Subj. Dry HandlingHigher is better | 2nd / 4 | 8.5 Points | -0.30 Points |
| Wet BrakingLower is better | 4th / 4 | 119 ft | +27 ft |
| Wet HandlingLower is better | 3rd / 4 | 111.54 s | +7.67 s |
| Subj. Wet HandlingHigher is better | 4th / 4 | 7.2 Points | -1.90 Points |
| Straight AquaHigher is better | 4th / 4 | 42.9 mph | -2.7 mph |
| Rolling ResistanceLower is better | 4th / 4 | 10.9 kg/t | +2.00 kg/t |
- UTQG
- 200 A A
- Tread
- 5.5 mm
Bridgestone Potenza Race
235/35 R19 91Y XL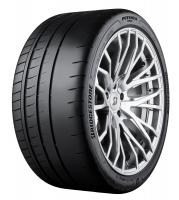
Category scores (% of best)
All discipline results (8)
Discipline positions compare the ranked tires in this test, not the whole market. These are individual measurements, not weighted overall scores.
| Test | Position in discipline | Result | Gap to best |
|---|---|---|---|
| Dry BrakingLower is better | 4th / 4 | 117 ft | +11 ft |
| Dry HandlingLower is better | 3rd / 4 | 81.37 s | +1.84 s |
| Subj. Dry HandlingHigher is better | 4th / 4 | 8.2 Points | -0.60 Points |
| Wet BrakingLower is better | 1st / 4 | 92 ft | Best in this discipline |
| Wet HandlingLower is better | 1st / 4 | 103.87 s | Best in this discipline |
| Subj. Wet HandlingHigher is better | 1st / 4 | 9.1 Points | Best in this discipline |
| Straight AquaHigher is better | 2nd / 4 | 45.4 mph | -0.2 mph |
| Rolling ResistanceLower is better | 1st / 4 | 8.9 kg/t | Best in this discipline |
- UTQG
- 200 A A
- Tread
- 6.3 mm
Discussion