Data Explorer / AutoView
2025 AutoView Extreme Performance Tire Test
- Tested size
- 275/35R19
- Tires tested
- 3
- Disciplines
- 3
- Test vehicle
- BMW M3 (G80)

Set the weightings
Move a slider. The other categories rebalance automatically to keep the total at 100%.
No test-specific category weights are recorded; this starts with season defaults.
Season defaults
Results
Movement is compared with the default calculation, not the published finishing order. Scores use unrounded totals for ranking.
No ranking for this setup. Give at least one category a positive weight and include a discipline in each active category, or reset the weights.
Filtering never changes the benchmark, scores or positions.
No tires selected. Add tires to your shortlist to focus the ranking.
| ft ↓ | s ↓ | ft ↓ | ||||||
|---|---|---|---|---|---|---|---|---|
| 1 | 1 | 100.00 | 101 | 85.15 | 100.0 | 91 | 100.0 | |
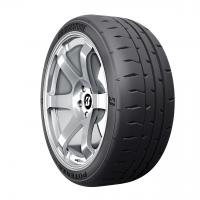
StrengthsThe Bridgestone Potenza RE71RS posts the shortest stop of the test in both dry (101 ft from 62 mph) and wet (91 ft from 50 mph), with the lowest tire-to-tire weight deviation of the three. Its front-to-rear grip balance is the most even on corner exit, so understeer is well suppressed and the M3 can pick up the throttle earlier than on the Yokohama. The tread blocks are softer than the A052's, which gives it noticeably better curb and bump compliance - the suspension stays composed where the Yokohama gets unsettled. The steer character is a stable progression from light understeer toward neutral and never surprises the driver. ConsiderationsSteering pointing precision is a step behind the A052; small inputs translate into grip with a slight time lag because the soft tread block sits on a stiff carcass. The tire is intolerant of slip - push past its narrow slip-angle window and it scrubs off speed sharply, so a clean, planned line is mandatory. Longitudinal grip falls off noticeably after the opening hot lap, more than the A052's. And of the three tires on test it is the loudest on highway pavement. Score contributionCategory score × of overall score Dry100 × 41% = 41 Wet100 × 59% = 59 | ||||||||
| 2 | 3 | 93.27 | 105 | 85.16 | 98.1 | 101 | 89.9 | |
StrengthsThe Yokohama Advan A052 is the lightest tire on test and the one that talks loudest to the driver: feedback is rigid, direct and consistent across loads, which is exactly the character a track driver looks for. It needs the smallest steering angle to hit a given line, responds fastest to small inputs, and holds grip at higher slip angles than either rival - overcooked entries come back without much speed loss. Its single best lap (1:25.16) is essentially tied with the RE71RS and 1.25 s clear of the SUR4G. ConsiderationsWet braking is the weakest of the three at 101 ft from 50 mph - nearly two meters longer than the Bridgestone - and the thin tread that helps in the dry is the obvious culprit; expected service life will also be shorter as a result. On corner exits with long throttle phases (Yeongam's T8 for example) the front gives up before the rear and understeer pulls speed out of the run. The carcass is stiff, so kerbs and bumps unsettle the chassis more than they do on the Bridgestone. Performance falls off after the opening lap, with about 1.4 s lost on lap two - lateral grip in particular drops away. Score contributionCategory score × of overall score Dry98.12 × 41% = 40.23 Wet89.9 × 59% = 53.04 | ||||||||
| 3 | 2 | 95.85 | 107 | 86.41 | 96.4 | 95 | 95.5 | |
StrengthsThe Nexen N'Fera SUR4G's signature strength is thermal stability - across the three flying laps at Yeongam its times barely move, where both rivals shed pace after the opening lap, so the SUR4G is the most forgiving tire on the test for a driver who misses the optimum window. It is also the quietest of the three on highway pavement (both on ISO certification road at 50 mph and on general road at 68 mph), the cheapest by some margin, and clearly the most appropriate of the three for repeated lapping practice. ConsiderationsSteering feedback is the softest and slowest of the three, with the lightest wheel weight and the least linear response. Under load the rear breaks away ahead of the driver's prediction, turning a neutral entry into a mild oversteer on exit - and recovery from an evasive input takes more steering and more time than on either rival. Both braking columns are the longest of the three (107 ft dry, 95 ft wet), the structure feels soft enough that the line has to be 'steered into' rather than aimed, and the Yeongam best lap (1:26.41) is 1.25 s off the front pair. Score contributionCategory score × of overall score Dry96.37 × 41% = 39.51 Wet95.5 × 59% = 56.35 | ||||||||
Raw results do not change when you move the sliders. Scroll horizontally to see every discipline.
Leading with these priorities
Bridgestone Potenza RE 71RS
These are calculated scenarios, not new test awards. The published verdict may reflect judgement, close results and factors outside this calculation.
Not ranked: a measurement needed for these weights is missing. Missing results are not treated as zero or redistributed.
Reference tires provide context only. They do not set the benchmark and cannot win the personalised ranking.
Weighting vs real impact
What decides this ranking
The weighting is how much each category counts. The real impact is how much of the difference between the tires it creates: a discipline in which every tire performed about the same barely changes the order, however much it counts.
No weighting is recorded for this test, so the weighting here starts from Tire Reviews’ season defaults, not from the test’s own scoring.
- Dry Weighting 41% Real impact 20%
- Wet Weighting 59% Real impact 80%
- Dry Handling counts for 20.5% of the score but creates only 4% of the difference, because most tires performed about the same in it.
Every discipline 3
| Discipline | Weighting | Real impact |
|---|---|---|
| Dry Braking | 20.5% | 16% |
| Dry Handling | 20.5% | 4% |
| Wet Braking | 59% | 80% |
How it is worked out: each discipline’s weighting is multiplied by the spread of its results (the gap across the middle half of the tires, as a percentage of the best result), then shared out so that all the disciplines add up to 100%. It estimates what separates the tires; it is not a second set of weights, and it follows the weights you set.

How your ranking is calculated
Each discipline is scored against the best non-reference tire in the full test field: best ÷ result × 100 when lower is better, or result ÷ best × 100 when higher is better. Discipline scores are rounded to two decimal places, then combined using your weights.
Within-category weights divide that category’s share of the overall score. A 50% wet category and 40% wet-braking share give wet braking 20% of the total. A weight is a scoring priority, not a measure of its actual effect on the ranking: the performance gaps matter too. What decides this ranking ↑
Published joint positions are preserved separately. Calculated positions tie only when their underlying scores match; two displayed scores can look equal after rounding.
A zero weight excludes that category or discipline. At least one active discipline is required, and the disciplines in every active category must have a positive total.
More tire tests
Cross-check this test
Where these tires were tested again, and how the verdict held up.
2025 Tire Rack Extreme Performance Track Tire Test
275/35 R187 tires tested
2 of these 3 tires tested again
2022 Tire Rack Extreme Performance Track Tire Test
225/45 R1711 tires tested
2 of these 3 tires tested again
2025 AutoView Sports Tire Test
275/35R195 tires tested
Tested in the same size