


245/40 R183 pressures, one tire8 measured tests
The Effect of Tire Pressure on Tire Performance: 1.7 vs 2.4 vs 3.1 Bar

Contents
Vi Bilagare has run a tire test in which the tire never changed. The Swedish magazine took an Audi A4 Avant fitted with Nokian Hakka Black 3 tires in 245/40 R18, and ran the same car, on the same set of tires, with the same driver, at three different pressures: the 2.4 bar (35 psi) the car specifies for its 18 inch wheels, then 0.7 bar (10 psi) either side of it at 1.7 bar (25 psi) and 3.1 bar (45 psi). Wet braking, wet circle grip, straight and curved aquaplaning, dry braking, rolling resistance and cabin noise were measured at every setting.
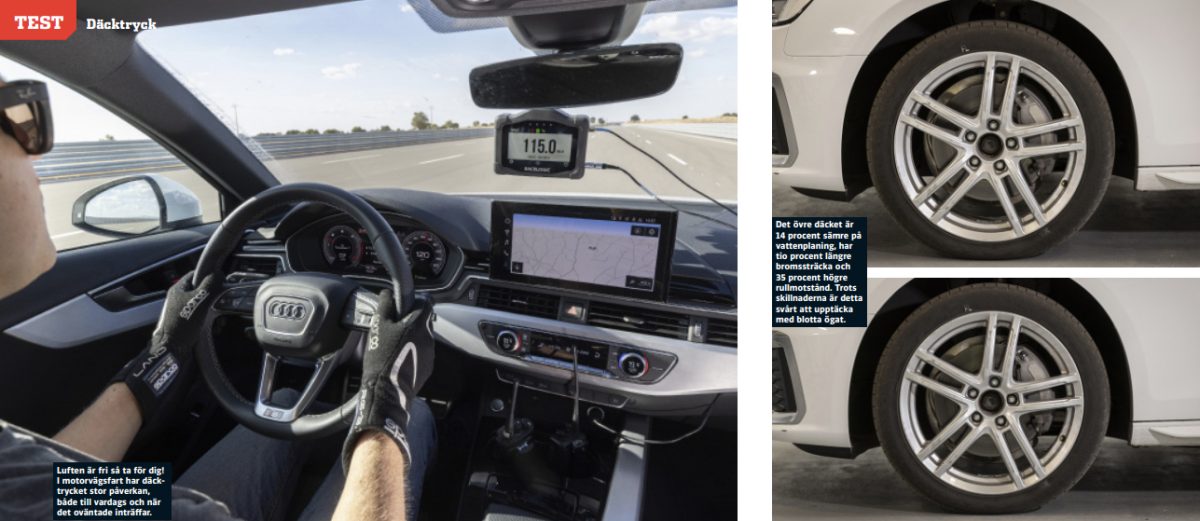
The headline is how lopsided the answer is. Running 0.7 bar (10 psi) low was expensive almost everywhere: over two meters more wet braking distance, the earliest aquaplaning by a wide margin, the slowest wet circle lap, a dry handling rating cut in half, and a rolling resistance penalty big enough to move the tire two full classes down the EU label. Running 0.7 bar (10 psi) high cost very little and in places helped, with the best aquaplaning resistance and the lowest rolling resistance of the three. Under-inflation is the problem. Over-inflation, within this range, mostly is not.
Independent test dataVi Bilagare
The runs were done alongside Vi Bilagare's 2023 summer tire test, on the same surfaces and against the same reference-tire trend, so the pressure figures sit on the same baseline as that group test. One deliberate omission: there are no wet or dry handling lap times. The tester judged the sidewalls too marginal at 1.7 bar (25 psi) to load them up at full lateral g, on the basis that the rim could end up touching the road, so the wet circle was used for measured lateral grip and dry handling was rated subjectively on the Hakka Ring oval instead. What follows is our summary of the headline findings. For the full test, the complete data and the methodology, read Vi Bilagare's original.
Wet Grip
The wet is where under-inflation is at its most expensive. At 1.7 bar (25 psi) the Audi needed 2.10 m more to stop from 80 km/h than it did at the specified pressure, which is roughly half a car length, and Vi Bilagare makes the point that this was measured from only 80 km/h. The same proportional loss from a higher speed is a much bigger distance. Over-inflation, by contrast, did nothing measurable: the gap between 3.1 bar (45 psi) and 2.4 bar (35 psi) is three centimeters.
The wet circle is the one test where the specified pressure wins outright, and it is worth dwelling on because it cuts against the assumption that more air simply means more grip. The 2.4 bar (35 psi) setting was quickest. Going up to 3.1 bar (45 psi) cost eight hundredths of a second, going down to 1.7 bar (25 psi) cost a third of a second. Lateral grip in the wet is the one thing the manufacturer's number is exactly right about.
Vi Bilagare's conclusion from the wet running is blunt: with the pressure neglected, the premium tire on test could neither brake nor corner better than the low-cost Chinese tire they were testing in parallel. Factoring in the aquaplaning results below, they rate the premium tire at 1.7 bar (25 psi) as offering a lower level of wet-road safety than the budget tire at its correct pressure. The money spent on the better tire is, in their words, essentially wasted if the pressure is not maintained.
Aquaplaning
Aquaplaning gave the clearest and most consistent response to pressure of anything in the test, and it is the one place where the extra 0.7 bar (10 psi) earns real money. Under-inflation lets the tire sag, which spreads the contact patch and makes it easier for the tire to ride up on top of standing water. Extra pressure stretches the tread pattern out and shrinks the contact area, so the tire keeps cutting through for longer. Straight-line float speed rose steadily with every increase in pressure.
Curved aquaplaning follows the same pattern but with more at stake. The swing from 1.7 bar (25 psi) to 3.1 bar (45 psi) is more than eleven km/h in the speed the car could carry through standing water at maximum lateral g, and the 8.7% gain from over-inflating is the largest single improvement anywhere in this test. The extra firmness in the sidewall appears to matter more once the water is being displaced in a corner.
Dry Grip And Steering
Dry braking is the one measured test the under-inflated tire wins. Less air means a bigger contact patch and more rubber on the road, and it produced the shortest stop of the three. The margin is small in absolute terms, though: the whole spread from best to worst is 0.72 m, against 2.13 m in the wet.
The way the car steers tells the opposite story, and much more strongly. At 1.7 bar (25 psi) the steering went heavy at low speed and needed noticeably more input at junctions and roundabouts. Out on the seven kilometer Hakka Ring oval it turned diffuse and non-linear: at 115 km/h even small steering inputs set off a secondary movement, the tester describing the car as rolling on its hips, and it took an unexpectedly long time to settle back straight. Lane changes lacked precision and the car was hard to place in the middle of its lane. At 3.1 bar (45 psi) the differences were far smaller, mostly showing up as a slightly faster response to larger inputs and better resistance to lateral load. The tester's note is worth repeating: knowing exactly what to look for, he still would not have guessed the pressure was too high on an ordinary commute.
Rolling Resistance And Running Costs
Rolling resistance was measured to the standard the EU tire label uses, and it produced the single biggest percentage change in the test. Dropping to 1.7 bar (25 psi) raised the coefficient by 26.8%, which is enough to take the tire from a C label rating to an E, the lowest class in use for car tires. Vi Bilagare puts the real-world effect at roughly 0.3 l/100 km more fuel for a petrol car, or about 30 km of lost range per charge for an EV. Going the other way to 3.1 bar (45 psi) improved rolling resistance by 9.0%, but not by enough to earn a better letter: it stays a C.
Cabin Noise
Interior noise is the second test where the under-inflated tire comes out ahead, and it is the more useful of the two consolations because it is the one a driver might actually notice day to day. The lowest pressure was the quietest at every speed and on both surfaces.
The measured spread is widest on smooth asphalt at motorway speed, but the tester reported the subjective difference being larger on the rough surface, where the character of the noise changed rather than just its level. At 3.1 bar (45 psi) there was a clear rumble in corners and low-frequency bass tones on smooth road that had not been there before. At 1.7 bar (25 psi) there was a whistling background noise that none of them had heard from the car previously, and which the sound meter did not pick up at all.
Wear
Wear was not run as a measured programme at each pressure, so Vi Bilagare gives the expected pattern rather than a figure. Both deviations from the specified pressure shorten tire life, but they do it in different places on the tread.
Checking Pressure Properly
Two practical points come out of the test that are worth more than the numbers. The first is that on a low-profile tire like this 245/40 R18, 0.7 bar (10 psi) low is essentially invisible. There is no visual cue. The only reliable way to find it is a proper gauge.
The second is that the car's specified pressure applies to cold tires, and the most common way to get this wrong is to check at the fuel station part way through a journey. By then the tires are at working temperature and the pressure has risen by 0.2 to 0.3 bar (3 to 4 psi), so setting them to the door-sticker figure while warm leaves the car permanently under-inflated by exactly that amount. Vi Bilagare notes that this is close to the deficit the roadside tire checks run by police and the tire industry in the Nordic countries keep finding. The same trap applies to tire pressure monitoring systems that ask the driver to confirm the tires are correctly inflated: reset the baseline on warm tires and the system will happily report a permanently low pressure as correct.
It is also worth adding a little pressure ahead of a cold trip, and to winter tires fitted in autumn while it is still above freezing, because pressure falls with temperature.
What It Means
Tire pressure is really about load. Too little air means the tire is carrying more than it is set up for, so it deforms more as it rolls and the shoulders take abnormal stress. Over a long period that risks damage to the carcass which cannot be seen from outside. Loading the car up without raising the pressure has the same effect as running low pressure on an empty car, which is why the manufacturer's laden figure exists and why 0.7 bar (10 psi) low is a much more realistic scenario than it sounds: a full car with a boot load and a roof box will get there on its own.
The practical conclusion is asymmetric, and it is the useful thing to take away. Running a little high costs you a marginally longer dry stop, a slightly slower wet circle lap and a noisier cabin, and buys you better aquaplaning resistance and lower rolling resistance. Running a little low costs you wet braking, wet grip, aquaplaning resistance, steering precision, fuel and tire life, and buys you a quieter cabin and a fractionally shorter dry stop. If you are going to be wrong about your tire pressure, be wrong on the high side.
This is our summary of the headline findings from Vi Bilagare's test. For the complete data, the full write-up and the rest of their tire testing, go to Vi Bilagare's tire test pages.
Tire Pressure FAQ
The questions this test answers directly, with the measured figures behind each one. All of it comes from Vi Bilagare's runs on one set of Nokian Hakka Black 3 tires in 245/40 R18, on an Audi A4 Avant, at 1.7, 2.4 and 3.1 bar (25, 35 and 45 psi).
Slightly too high. The effects are strongly asymmetric. Running 0.7 bar (10 psi) below the car's specified pressure cost wet braking distance, wet grip, aquaplaning resistance, steering precision, fuel and tire life. Running 0.7 bar (10 psi) above it cost only a fractionally longer dry stop, a slightly slower wet circle lap and a little more cabin noise, while improving both aquaplaning resistance and rolling resistance. If you cannot be exact, err on the high side.
On a wet road, substantially. At 1.7 bar (25 psi) instead of the specified 2.4 bar (35 psi), the test car needed 25.80 m to stop from 80 km/h against 23.70 m at the correct pressure. That is 2.10 m longer, roughly half a car length, and it was measured from only 80 km/h, so the same proportional loss from higher speeds means a much greater distance. On dry asphalt the effect reverses slightly: the under-inflated tire stopped shortest at 33.01 m from 100 km/h, but the entire dry spread was only 0.72 m.
It makes aquaplaning start sooner, and this was the largest single effect in the test. Straight-line aquaplaning began at 72.3 km/h at 1.7 bar (25 psi), 80.8 km/h at the specified 2.4 bar (35 psi) and 84.1 km/h at 3.1 bar (45 psi). In a curve, the speed the car could carry through standing water rose from 57.5 km/h to 63.4 km/h to 68.9 km/h across the same three pressures. Under-inflation lets the tire sag and spread its contact patch, which makes it easier for the tire to ride up on top of the water.
Running 0.7 bar (10 psi) low raised rolling resistance by 26.8%, from 8.72 kg/t to 11.06 kg/t, measured to the EU tire label standard. That is enough to drop the same tire from a C rating to an E, the lowest class in use for car tires. Vi Bilagare put the real-world cost at roughly 0.3 l/100 km more fuel in a petrol car, or about 30 km of lost range per charge in an electric one.
Not reliably. Higher pressure clearly improved aquaplaning resistance and rolling resistance, and made no measurable difference to wet braking. But the specified 2.4 bar (35 psi) won the wet circle outright, with 3.1 bar (45 psi) eight hundredths of a second slower, and 3.1 bar produced the longest dry braking distance of the three at 33.73 m. More air is not simply more grip.
Usually not. On the low-profile 245/40 R18 tires used in this test, running 0.7 bar (10 psi) below the correct pressure was almost impossible to spot by eye. There is no reliable visual cue on a modern low-profile tire, so the only dependable check is a proper pressure gauge.
Cold. The pressure printed on the car's placard applies to cold tires. After driving, the tires reach working temperature and the pressure rises by roughly 0.2 to 0.3 bar (3 to 4 psi), so setting them to the placard figure at a fuel station part way through a journey leaves the car permanently under-inflated by exactly that amount. The same trap catches tire pressure monitoring systems that ask the driver to confirm the tires are correctly inflated: reset the baseline on warm tires and the system will report a permanently low pressure as correct.
Yes, and the lowest pressure was the quietest. Averaged across the measured runs, the cabin recorded 67.0 dB(A) at 1.7 bar (25 psi), 67.8 dB(A) at the specified 2.4 bar (35 psi) and 68.7 dB(A) at 3.1 bar (45 psi). The character of the noise changed as well as the level: at high pressure there was a clear rumble in corners and low-frequency bass tones on smooth roads, while at low pressure the testers heard a whistling background noise that the sound meter did not register at all.
It changes where the tread wears rather than simply how fast. At the correct pressure, wear is spread evenly across the tread. Too little pressure concentrates it on the shoulders, and too much concentrates it in the center. Both shorten the usable life of the tire. Vi Bilagare gave these as expected patterns rather than measured figures, because no separate wear programme was run at each pressure.
Not according to this test. Vi Bilagare ran a low-cost Chinese tire alongside the premium Nokian and concluded that, with the pressure neglected, the premium tire could neither brake nor corner better than the budget one. Taking the aquaplaning results into account as well, they rated the premium tire at 1.7 bar (25 psi) as offering a lower level of wet-road safety than the budget tire at its correct pressure. The money spent on better tires is largely wasted if the pressure is not maintained.
Yes. Tire pressure is fundamentally about load: too little air means the tire is carrying more than it is set up for, so it deforms more as it rolls and the shoulders take abnormal stress. Loading a car up without raising the pressure has the same effect as running low pressure on an empty car, which is why manufacturers publish a separate laden figure. It also makes 0.7 bar (10 psi) low a realistic everyday scenario rather than an extreme one: a full car with a loaded boot and a roof box gets there on its own.

Filed under Magazine tire testsTire Guide
More on Magazine tire tests
Summer, All Season and Winter Tires Tested at 0c to15cUntil recently it's been impossible as you can't control the weather, and even if you started to test at a certain temperature outdoors, the weather w... Goodyear Eagle F1 SuperSport R & RS - First TestThe recently released Goodyear Eagle F1 SuperSport R & RS tires are Goodyears new entry into the hypercar / track car segment, and what better way to...  The differences between 17, 18 and 19 inch tiresIs a 17" wheel more comfortable than a 18" wheel? Does a 19" wheel feel more sporty than its smaller brother? As always with tires, the answer is yes,...
 2013 Winter Tire Buying GuideThanks to recent harsh winters, the best tire for the UK roads is a hot topic, and with 2013 predicted to be the harshest winter of recent times, now...
The differences between 17, 18 and 19 inch tiresIs a 17" wheel more comfortable than a 18" wheel? Does a 19" wheel feel more sporty than its smaller brother? As always with tires, the answer is yes,... 2013 Winter Tire Buying GuideThanks to recent harsh winters, the best tire for the UK roads is a hot topic, and with 2013 predicted to be the harshest winter of recent times, now...
Discussion
2 comments