P27 of 31
Beat 13% of the field
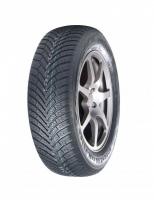
Linglong Green Max All Season Test Results
Tested 2018 to 2019
1 publication
Tested 2 times by independent publications, the Linglong Green Max All Season averages a finish of 24th.
- 2Independent tests
- 0Test wins
- 0Podium finishes
- 24thAverage finish
- 20%Field beaten on average
- 1Publications

2 tests, 2018 to 2019

Record by discipline
Where the Linglong Green Max All Season finished in each measured discipline, across every test that measured it against at least two other tires. Field beaten is the share of the other tires it outranked in that measurement.
| Discipline | Tests | Avg finish | Field beaten | Firsts |
|---|---|---|---|---|
| Dry | ||||
| Dry Braking | 1 | P8 of 31 | 77% | - |
| Wet | ||||
| Wet Braking | 1 | P29 of 31 | 7% | - |
Performance Analysis
Drawn from 2 tests. Updated October 29, 2026.
The Linglong Green Max All Season finished in the lower part of the field in both Auto Bild braking overviews: 27th of 31 in 2019 and 20th of 27 in 2018. The 2019 test in 225/45 R17 shows the main contrast, with wet braking 29th of 31 at 59.4 m, 28.3% longer than the best.
Dry braking was more competitive in that same test, eighth of 31 at 42.9 m, although still 8.6% longer than the shortest stop. No individual results accompany the 2018 195/65 R15 comparison, so it cannot confirm that dry-road strength or establish a repeated wet-braking margin. There are no handling, snow, comfort or wear results here to broaden the assessment beyond braking.
Performance Strengths
-
Dry braking
Minor
Details
- 8th of 31, 42.9 m and 8.6% longer than best, 2019 Auto Bild All Season Tire Performance Overview
Performance Weaknesses
-
Wet braking
Minor
Details
- 29th of 31, 59.4 m and 28.3% longer than best, 2019 Auto Bild All Season Tire Performance Overview
Every test, newest first 2
Strong = top two of the field in that measurement. Weak = bottom two.
Back to the Linglong Green Max All Season overview
Owner reviews, sizes and EU label data, comparisons and the Tire Reviews score. All Linglong tires