

Pirelli Cinturato All Season SF3 vs Michelin CrossClimate 3 vs Vredestein Quatrac Pro 2
3 tires ranked on the 3 independent tests that drove all of them together. Every measurement is scored against the best of the group, then weighted by discipline; move the weighting and the leaderboard re-ranks.
The quick answer
On the Balanced weighting the Vredestein Quatrac Pro 2 leads with 98.4%, 0.5 points ahead of the Pirelli Cinturato All Season SF3.
-
1
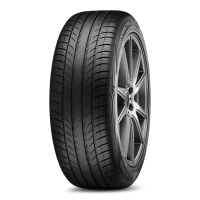 Vredestein Quatrac Pro 2
98.4%leads
-
2
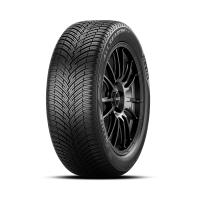 Pirelli Cinturato All Season SF3
97.9%0.5 pts behind
-
3
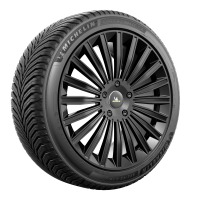 Michelin CrossClimate 3
97.9%0.5 pts behind
Scores are relative: in every measurement the best tire of the group scores 100% and the rest are scaled to it, so a tire can rank first here and still trail a tire that never shared a test with it. Data updated October 2026.

Leaderboard
Each discipline score is the weighted mean of its measurements across the 3 shared tests, and the total is the weighted mean of the disciplines. Pick a preset or set the sliders yourself, then update: the table below re-ranks without leaving the page.
Adjust Category Weighting
Adjust the importance of each performance category to see how different priorities affect the overall ranking across all shared tests.
Fine-tune sub-categories
Dry
Wet
Snow
Comfort
Value
| Rank | Tire | Score | Dry | Wet | Snow | Comfort | Value |
|---|---|---|---|---|---|---|---|
| 1 | Vredestein Quatrac Pro 2 | 98.4% | 98% | 99.8% | 98.3% | 100% | 88.4% |
| 2 | Pirelli Cinturato All Season SF3 | 97.9% | 99.8% | 99.1% | 94.6% | 96.2% | 98% |
| 3 | Michelin CrossClimate 3 | 97.9% | 98.4% | 96.6% | 99.9% | 98.3% | 93.7% |
Discipline columns show the score on the current weighting; 100% means the tire was best of the group in every measurement of that discipline.
Performance overview
One axis per measurement, with the best tire of the group at the rim. The larger the shape, the fewer weak spots.
Every measurement
Averaged across the shared tests, in the unit each test recorded. The direction under each title says which way is better.
Full data table
The averaged figure behind every bar above, grouped by discipline. The best figure in each row is marked.
| Metric | Pirelli Cinturato All Season SF3 | Michelin CrossClimate 3 | Vredestein Quatrac Pro 2 |
|---|---|---|---|
| Dry | |||
| Dry Braking ftlower is better | 124 | 128 | 128 |
| Dry Handling mphhigher is better | 65.3 | 65.6 | 65.2 |
| Wet | |||
| Wet Braking ftlower is better | 153 | 162 | 150 |
| Wet Handling mphhigher is better | 48.2 | 47.5 | 48.2 |
| Wet Circle slower is better | 13.7 | 13.92 | 13.54 |
| Straight Aqua mphhigher is better | 53.6 | 53.2 | 53.1 |
| Curved Aquaplaning ft/s²higher is better | 9.9 | 9.7 | 9.7 |
| Snow | |||
| Snow Braking ftlower is better | 93 | 83 | 83 |
| Snow Traction lbfhigher is better | 637 | 667 | 625 |
| Snow Handling mphhigher is better | 36.5 | 36.9 | 36.7 |
| Snow Slalom ft/s²higher is better | 11.2 | 11.8 | 11.8 |
| Comfort | |||
| Subj. Comfort Pointshigher is better | 9.2 | 9.5 | 9.6 |
| Noise dBlower is better | 71.35 | 70.65 | 68.9 |
| Value | |||
| Wear mileshigher is better | 39675 | 36319 | 35729 |
| Value Price/1000lower is better | 6.58 | 8.04 | 6.61 |
| Rolling Resistance kg / tlower is better | 7.62 | 7.5 | 7.8 |
| Abrasion glower is better | 248 | 230 | 359 |
Test-by-test record
Across the 3 shared tests, the tire that finished highest takes the win; a tie at the top is a draw. The finishing positions are against the whole field of each test, not just these tires.
| # | Tire | Wins | Draws | Losses | Avg. position | Best |
|---|---|---|---|---|---|---|
| 1 | Pirelli Cinturato All Season SF3 | 1 | 1 | 1 | 3 | P2 |
| 2 | Vredestein Quatrac Pro 2 | 1 | 1 | 1 | 3.3 | P2 |
| 3 | Michelin CrossClimate 3 | 0 | 0 | 3 | 6.7 | P4 |
The 3 shared tests
| Test | Quatrac Pro 2 | Cinturato All Season SF3 | CrossClimate 3 |
|---|---|---|---|
| 2026 Auto Bild All Season Tire Test | P2 | P2 | P4 |
| 2026 All Season Tire Braking Test - 30 Sets | P6 | P2 | P12 |
| 2026 Auto Bild Allrad SUV All Season Tire Test | P2 | P5 | P4 |
Two at a time
One head-to-head page exists for a pair in this group, with the full measurement-by-measurement record for just those two.
Frequently Asked Questions
Which is the best tire overall?
Across 3 shared independent tests, the Vredestein Quatrac Pro 2 ranks highest overall with a score of 98.4%, ahead of the Pirelli Cinturato All Season SF3 (97.9%).
Which tire has the best wet braking?
The Vredestein Quatrac Pro 2 has the best wet braking across 3 shared tests, averaging 150ft.
Which tire has the best dry braking?
The Pirelli Cinturato All Season SF3 has the best dry braking across 3 shared tests, averaging 124ft.
Which tire has the best wear?
The Pirelli Cinturato All Season SF3 has the best wear across 3 shared tests, averaging 39675miles.
Which tire has the best rolling resistance?
The Michelin CrossClimate 3 has the best rolling resistance across 3 shared tests, averaging 7.5kg / t.
Which tire has the best snow braking?
The Michelin CrossClimate 3 has the best snow braking across 3 shared tests, averaging 83ft.
Which tire do owners rate highest?
The Vredestein Quatrac Pro 2 has the highest owner rating at 89% from 3 reviews.
Build your own group
Any two to eight tires that have been in the same independent test can be ranked the same way.
Run one of these?
Your review adds what no test can: how the tire wore, how it aged, what it was like in the rain in year three. It takes about five minutes.
Review the Quatrac Pro 2 Review the Cinturato All Season SF3 Review the CrossClimate 3
Where this data comes from
Measurements and finishing positions are transcribed from each published test. A test only counts here when every tire in the group ran in it, so each figure was recorded on the same car, size and day as the ones beside it.
About the scoring
In each measurement the best average of the group scores 100% and the others are scaled to it. Discipline scores weight those measurements, the total weights the disciplines, and the default weighting follows the season of the tires.
Who does the testing
Every test published as a Tire Reviews test is run by Jonathan Benson, who has been testing tires independently since 2007.